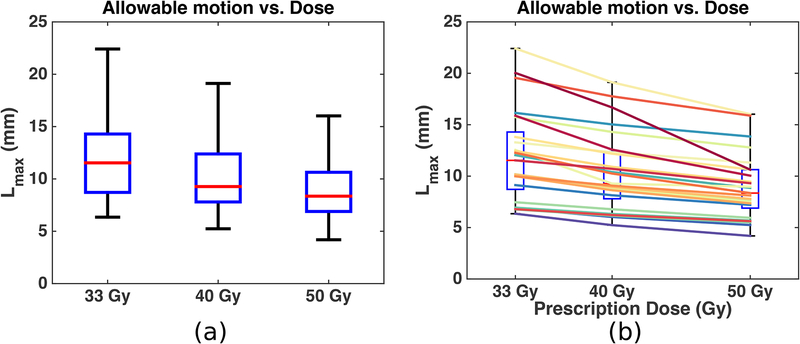
Figure 4:
Allowable motion vs. prescription dose for all 25 patients (a) and for each patient (b). (a): The boxplot shows the median (red center line), [25th—75th] percentile (blue box) and [minimum—maximum] range (black whiskers) of the 25 Lmax at each dose level. (b): Each colored-solid line represents one patient; the same boxplot in (a) is placed in the background for reference.

