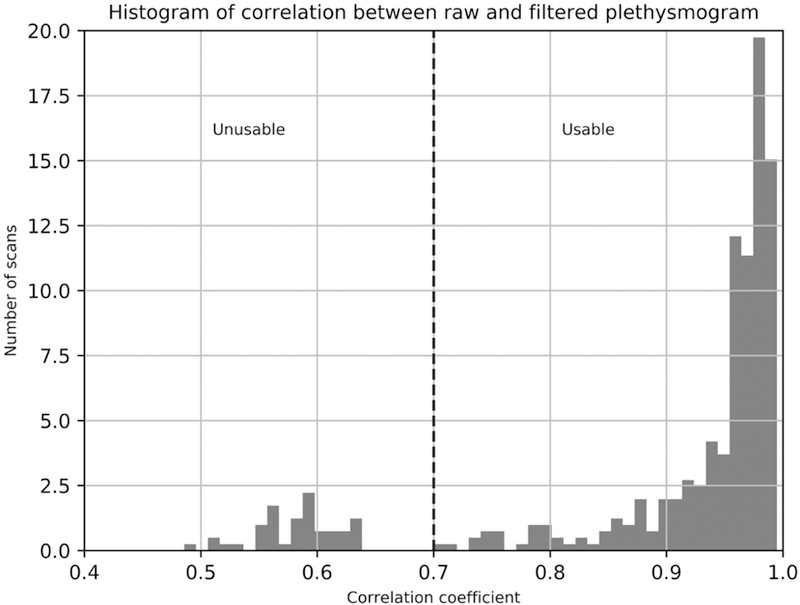
Figure 9.

Histogram of crosscorrelation values between plethysmogram waveforms before and after application of the deep learning filter. High quality plethysmograms are not significantly changed by the filter, but signals without a strong cardiac waveform are. “Unusable” plethysmograms were visually verified to have either no signal, extremely poor SNR, strong artifacts, or distorted cardiac waveforms. 47 of 400 runs (11.75%) were found to be unusable.
