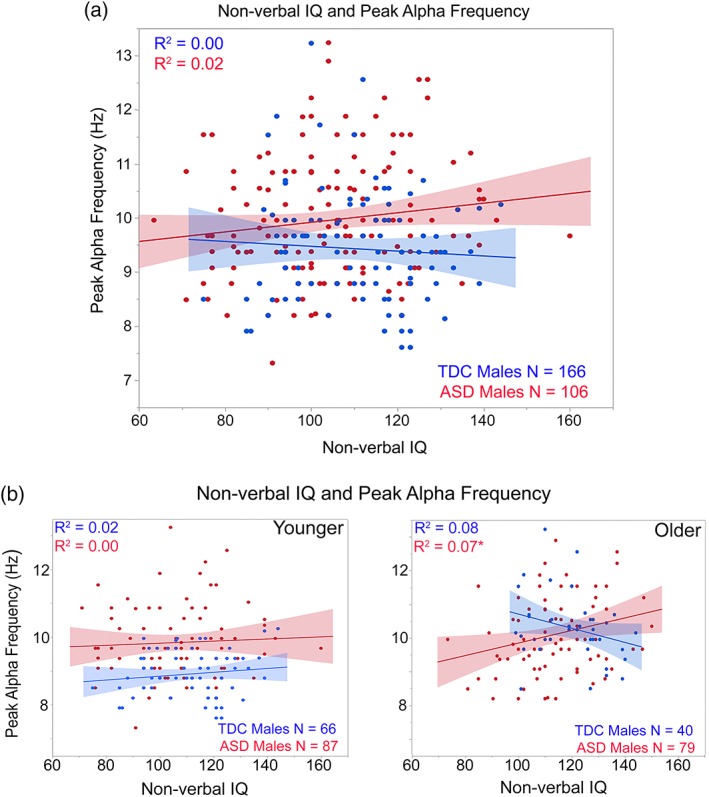
Figure 3.

(a) Scatterplots showing associations between nonverbal IQ (x axis) and peak alpha frequency (y axis) for TDC (blue) and ASD (red). (b) Nonverbal IQ and peak alpha frequency associations shown for the younger (<10‐years‐old; left plot) and older children (>10‐years‐old; right plot). *p < 0.05 [Color figure can be viewed at http://wileyonlinelibrary.com]
