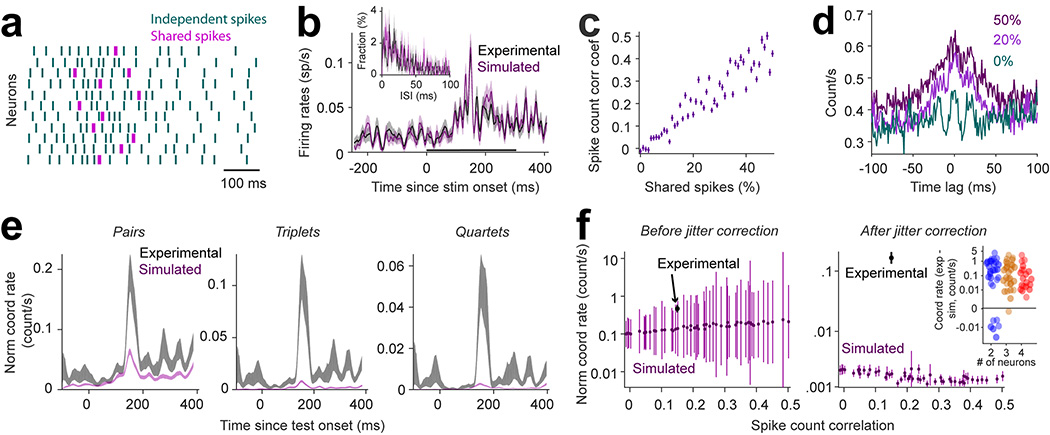
Figure 2 |. Simulation of correlated spike trains with similar statistics as recorded neurons, except for coordinated spiking.
(a) Spike trains of simulated neurons generated using independent Poisson processes (green) and shared spikes (magenta) that increase the spike count correlation without increasing spike-time correlations (shared spikes are within the same 25 ms window, whereas coordinated spikes are within the same 5 ms window). (b) Trial-averaged histogram of spike counts (n=200) shown for an interval 200-ms before stimulus onset to 500-ms after stimulus onset for a real and simulated neuron. The black bar represents the interval of test stimulus presentation. Inset: Histogram of the inter-spike time interval for one experimental neuron and its corresponding simulated neuron. For all the neurons in our population, the distributions of inter-spike time intervals for the simulated neurons matched the experimental ones (2 sided Kolmogorov–Smirnov test, p> 0.68). Shaded areas represent SEM across trials. (c) Correlation coefficients of spike counts across trials (n=200) averaged for all the pairs (n=66) of the simulated population as a function of percentage of shared spikes. (d) Cross-correlogram averaged across trials and pairs for the neural population for different percentages of shared spikes. (e) Peri-stimulus time histogram of coordinated rates for experimental and simulated neural populations shown separately for pairs, triplets, and quartets. The spike count correlation within the simulated population was matched to that of the real population using the regression fit from panel c. Shaded areas represent SEM across trials (n=200). (f) (left) Raw coordinated rates averaged for all neuronal assemblies (combining size 2 to 12) regardless of significance of their occurrence, for the simulated and experimental spike trains. (right) Coordination rates from the left panel after subtracting the coordination rates of surrogate data generated by jittering the spike trains (jitter range = 10 ms) for the simulated and experimental spike trains. The simulation was repeated 100 times for each data point. Data points: trial average (n=200), error bars: SEM. (inset) The difference between coordination rates of experimental and simulated populations for our 34 recording sessions.

