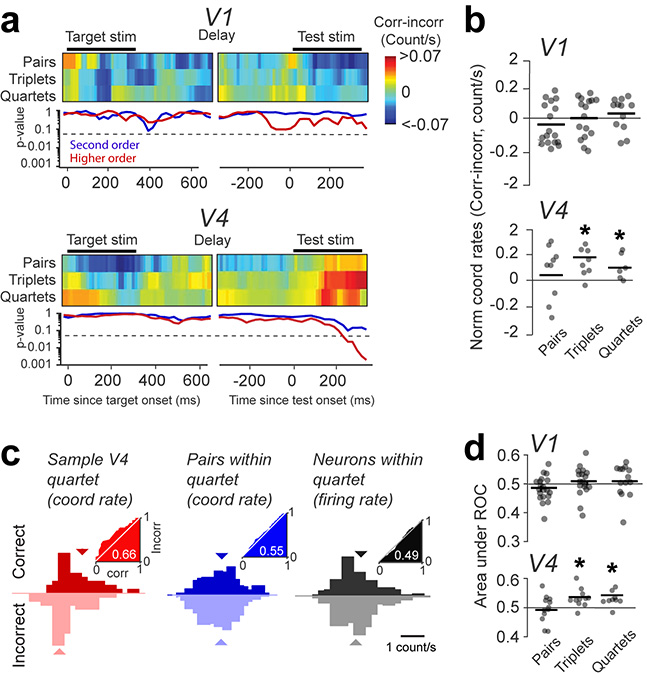
Figure 4 |. Population effects – correct trials are associated with higher order coordination in area V4.
(a) Top panels: The difference in coordination rates (for pairs, triplets, and quartets) between correct and incorrect trials measured using a 300-ms window shifted in 10-ms increments (average of sessions; n=22 for V1, and n=12 for V4). The small gap during the delay period is due to the variable interval between target and test. Bottom panels: Statistical significance of the 2-sided Wilcoxon signed rank test (P-value) for the difference in coordination rates between correct and incorrect trials. Triplets and quartets are combined as ‘higher-order’ coordination events. The dashed lines mark the significance threshold of the p-value (0.05). (b) Normalized coordination rates for pairs, triplets, and quartets, measured for the 300 ms window starting 150 ms after test onset (dots represent individual sessions). A hyperbolic scale was used for the y-axis to optimize representations for all sessions (n=22 for V1, and n=12 for V4). The bar shows average across sessions. The star indicates statistical significance (see Methods). (c) The distribution of coordination rates for (left) correct and incorrect trials for a sample quartet, (middle) all six possible pairs within the quartet, and (right) the firing rates of all four neurons within the quartet. Insets: ROC curves for correct vs. incorrect trials. (d) AROC for correct vs. incorrect trials averaged across all coordination events of the same order (pairs, triplets, quartets) within each session (dots represent individual sessions).

