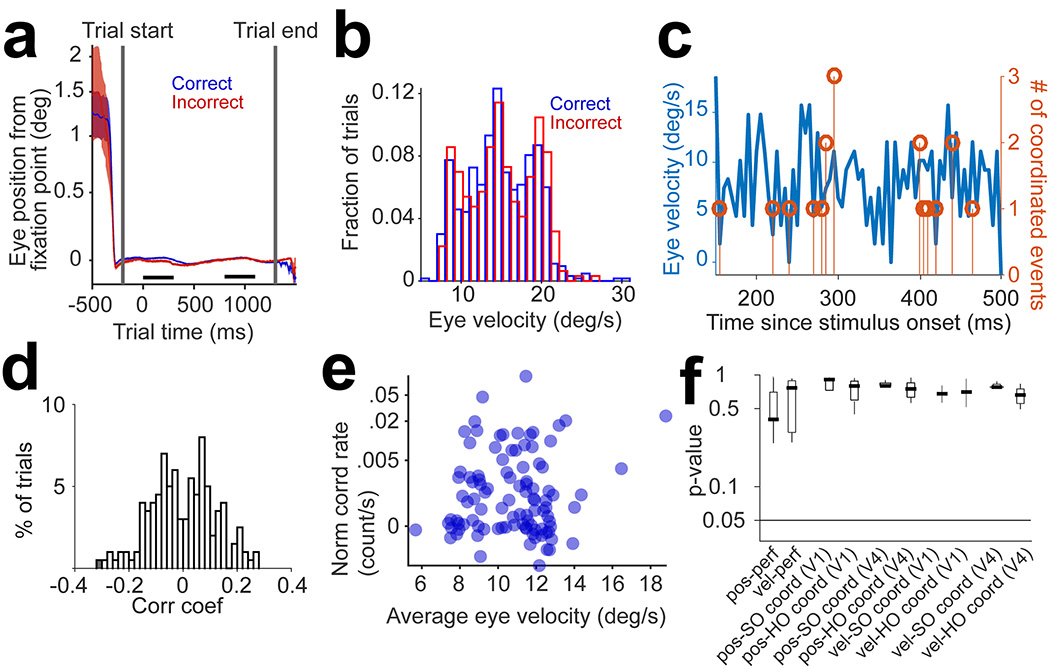
Figure 6 |. Coordination rates are unrelated to eye movements.
(a) Average traces of eye position relative to the fixation point, averaged across correct (n=75) and incorrect (n=25) trials in a sample session. The black bars represent the intervals when target and test stimuli are presented. (b) Trial distributions of eye velocity for correct (n=633) and incorrect (n=315) trials are not statistically different (p=0.54, 2-sided Wilcoxon Rank-sum test). (c) Single trial trace of eye velocity (left y-axis) and number of coordinated events (right y-axis) for a sample trial as a function of time since test onset (the time bin is 5 ms). (d) Distribution of Pearson’s correlation coefficients of eye velocity and coordination rates, regardless of order, across trials (n=948) for all sessions (p=0.3, 2-sided t-test). Only one trial in V1 and one trial in V4 showed significant (p<0.05) correlation coefficients. This analysis was performed by computing the cross-correlogram between the number of coordinated events and eye velocity (the two traces in panel c), averaged over trials across sessions (in V1 and V4). The cross-correlograms were corrected for the slow co-fluctuations of the two variables by using a 50-ms smoothing kernel and subtracting the cross-correlation of smoothed traces from the original one. Each cross-correlation was z-scored before averaging. (e) Trial by trial correlation of eye velocity and V1–V4 coordination, including 2nd order and higher order events (calculated for the time lag of the peak V1–V4 coordination, as reported in the manuscript). Trials are pooled from 3 representative sessions (n=300). Both eye velocity and coordination rates were z-scored before calculating the Pearson’s correlation coefficient (r=0.06, p=0.3, 2-sided t-test). (f) Median p-values for the eye position and eye movement control analyses and their correlation with coordination rates, averaged across sessions (V1: n=22, V4: n=12; results reported for the 300-ms test stimulus presentation) – pos-perf: difference between eye position in correct and incorrect trials (p-value for 2-sided Wilcoxon Rank-sum test); vel-perf: difference between eye velocity in correct and incorrect trials (p-value for 2-sided Wilcoxon Rank-sum test); pos-SO coord: Pearson’s correlation between eye position and 2nd order (SO) coordination rates (separately for V1 and V4); pos-HO coord: Pearson’s correlation between eye position and higher order (HO) coordination rates (separately for V1 and V4); vel-SO coord: Pearson’s correlation between eye velocity and 2nd order (SO) coordination rates (separately for V1 and V4); vel-HO coord: Pearson’s correlation between eye velocity and higher order (HO) coordination rates (separately for V1 and V4). For all Pearson correlations, the p-value for the 2-sided t-test was used. For each box plot, the middle bar shows the median, the box shows the 25th higher and lower percentiles, and the whiskers show the range of the data points.

