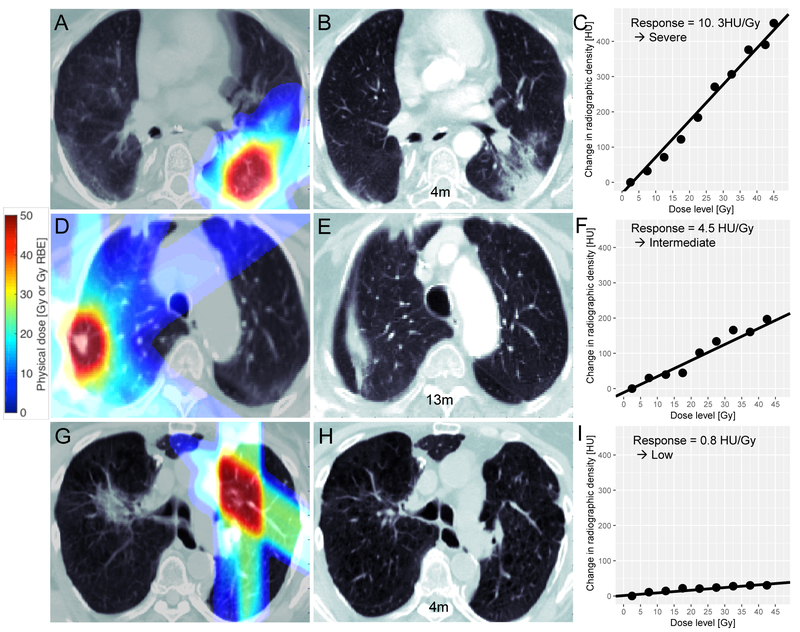
Fig 1.
Illustration of SBPT (top and bottom row) and SBRT (middle row) treatment plans and assessment of lung parenchyma responses. Left column (A, D, G) planning chest CTs with dose map overlaid; Middle column (B, E, H): Example follow up CTs; Right column (C, F, I): dose response curves with linear fit showing severe, intermediate and low normal lung response; the dots represent change in radiographic change obtained from comparing the follow up CT with the planning CT and the lines represent the linear regression fit to the dose response curves. Linear regression was voxel-weighted, i.e. each point in a dose bin was weighted by the number of its constituent voxels.

