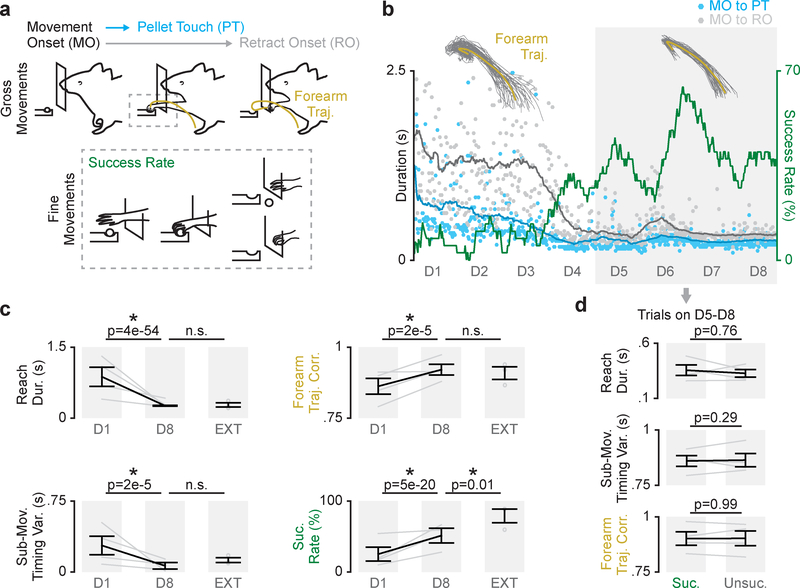
Figure 1. Refinement of skilled fine and gross movements is dissociable during reach-to-grasp skill learning.
a. Diagram of skilled reach-to-grasp task and measures of learning including duration from movement onset (MO) to pellet touch (PT), duration from movement onset to retract onset (RO), forearm trajectory correlation, and success rate. b. Example time course of learning (dots represent individual trials, lines are averaged over 30 trials; forearm trajectories are shown from day one and day eight, individual trial trajectories in grey and mean trajectory in yellow). c. Difference in reach duration, sub-movement timing variability, forearm trajectory correlation, and success rate between day one (D1) and day eight (D8) of training in learning cohort (n = 4 animals), and performance from an extended training cohort (EXT; n = 3 animals). Grey lines represent individual animals from learning cohort on day one and day eight, grey dots represent individual animals in extended training cohort, and black lines represent mean and SEM across animals. P values are from mixed-effects models. d. Differences in reach duration, sub-movement timing variability, and forearm trajectory correlation between successful (Suc.) and unsuccessful (Unsuc.) trials on days 5–8 (n = 4 animals). Grey lines represent mean values from each animal in learning cohort and black lines represent mean and SEM across animals. P values are from mixed-effects models.

