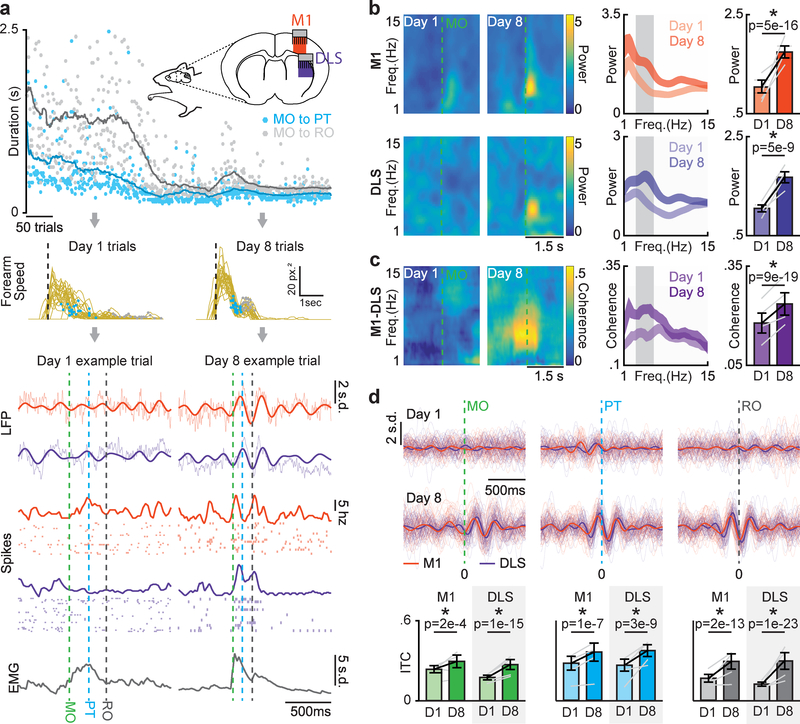
Figure 2. Coordinated movement-related activity emerges across M1 and DLS during skill learning.
a. Diagram of emerging low-frequency dynamics across forearm speed profile, neural activity in M1 and DLS, and forearm muscle activity during reach-to-grasp skill learning. Top: Illustration of recoding scheme and example time course of learning for duration from movement onset to retract onset (gray) and movement onset to pellet touch (blue; dots represent individual trials, lines are averaged over 30 trials). Middle: Forearm speed profiles for all trials on day one and day eight with timing of pellet touch (blue dots) and retract onset (grey dots) overlaid for example animal. Bottom: neural activity and forearm muscle activity for representative successful trials from day one and day eight. b. Left: Spectrograms from example M1 and DLS LFP channels. Middle: Mean M1 and DLS LFP power spectrums across animals (n = 4 animals; width denotes mean ± SEM). Right: Difference in 3–6Hz M1 and DLS LFP power from day one to day eight. Grey lines represent mean power from individual animals (n = 4 animals) and black lines represent mean and SEM across animals. P values from mixed-effects models. c. Left: Coherograms from example M1-DLS LFP channel pair. Middle: Mean coherence spectrum across animals (n = 4 animals; width denotes mean ± SEM). Right: Difference in 3–6Hz M1-DLS LFP coherence from day one to day eight. Grey lines represent mean coherence from individual animals (n = 4 animals) and black lines represent mean and SEM across animals. P values from mixed-effects models. d. Top: 3–6Hz filtered LFP from example M1 and DLS channels time locked to sub-movements, individual trials with mean signal overlaid. Bottom: Changes in inter-trial coherence (ITC). Grey lines represent mean inter-trial coherence from individual animals (n = 4 animals) and black lines represent mean and SEM across animals. P values from mixed-effects models.

