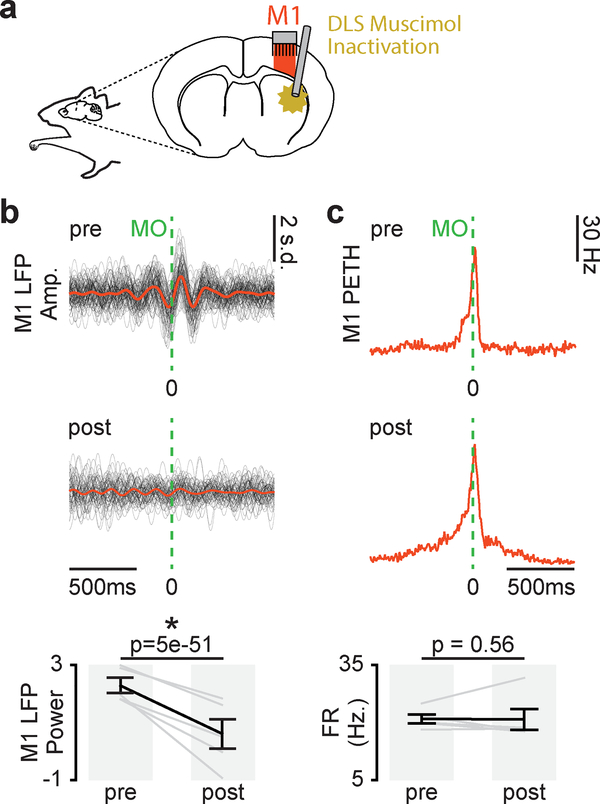
Figure 6. DLS inactivation decreases movement-related low-frequency M1 activity.
a. Illustration of DLS muscimol infusion and M1 recording. b. Left: 3–6Hz filtered LFP aligned to movement onset from example M1 channel for trials before and after DLS inactivation, individual trials overlaid with mean signal. Right: Difference in movement-related 3–6Hz LFP power in M1 before and after DLS inactivation (n = 5 sessions across 3 animals). Grey lines represent mean power values from individual sessions and black lines represent mean and SEM across sessions. P values from mixed-effects model. c. Left: PETH from example M1 unit for trials before and after DLS inactivation. Right: Difference in movement-related firing rate before and after DLS inactivation (n = 5 sessions across 4 animals). Grey lines represent mean firing rate across units from individual sessions and black lines represent mean and SEM across sessions. P values from mixed-effects model.

