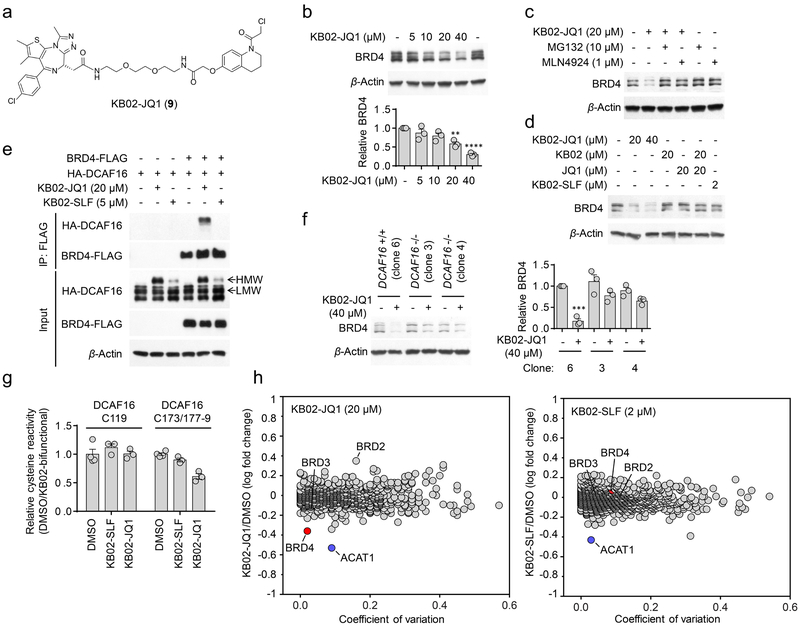
Figure 6. KB02-JQ1 degrades BRD4 by sub-stoichiometric modification of DCAF16.
a, Structure of KB02-JQ1. b, Concentration-dependent degradation of endogenous BRD4 in HEK293T cells following treatment with KB02-JQ1 for 24 h. Bar graph (bottom) is quantification of the relative BRD4 level. The BRD4 level from DMSO-treated cells is set to 1. Data represent mean values ± SEM (n = 3 biologically independent experiments). Statistical significance was calculated with unpaired two-tailed Student’s t-tests comparing DMSO- to KB02-JQ1-treated samples. **P < 0.01; ****P < 0.0001. P values were 0.0014 and 0.000012. Full images of blots are shown in Supplementary Fig. 14. c, KB02-JQ1-mediated BRD4 degradation is blocked by proteasome inhibitor MG132 and neddylation inhibitor MLN4924. HEK293T cells were preincubated with 10 µM MG132 or 1 µM MLN4924 for 4 h, followed by 20 h of treatment with 20 µM KB02-JQ1 and 10 µM MG132 or 1 µM MLN4924. The result is a representative of three experiments (n = 3 biologically independent experiments). Full images of blots are shown in Supplementary Fig. 14. d, Western blot of BRD4 in HEK293T cells following treatment with the indicated concentrations of KB02-JQ1, KB02, JQ1, KB02-SLF, or the combination of KB02 and JQ1 (24 h). The result is a representative of two experiments (n = 2 biologically independent experiments). The experiment is repeated twice independently with similar results. Full images of blots are shown in Supplementary Fig. 14. e, FLAG-tagged BRD4 co-immunoprecipitated with HA-DCAF16 in the presence of KB02-JQ1, but not KB02-SLF. HEK293T cells were co-transfected with BRD4-FLAG and HA-DCAF16 or pRK5 vector for 24 h and treated with KB02-JQ1 (20 µM), KB02-SLF (5 µM), or DMSO in the presence of MG132 (10 µM) for 2 h. The experiment is repeated four times independently with similar results. Full images of blots are shown in Supplementary Fig. 14. f, Degradation of BRD4 in HEK293 DCAF16+/+ (clone 6) and −/− (clone 3 and 4) cells following 24 h of treatment with 40 µM KB02-JQ1. Bar graph (right) represents quantification of the relative BRD4 protein content, with DMSO-treated cells set to a value of 1. Data represent mean values ± SEM (n = 3 biologically independent experiments). Statistical significance was calculated with unpaired two-tailed Student’s t-tests comparing DMSO- to KB02-JQ1-treated samples. ***P < 0.001. P value was 0.00014. Full images of blots are shown in Supplementary Fig. 14. g, Competitive ABPP results measuring relative reactivity (DMSO/KB02-bifunctional) of C119- and C173/C177–179-containing DCAF16 tryptic peptides from DMSO-, 2 µM KB02-SLF-, or 20 µM KB02-JQ1-treated HEK293T cells, with the peptide signals from DMSO-treated cells set to a value of 1. Data represent mean values ± SEM (n = 3 biologically independent samples). See Supplementary Fig. 12 for more details on the experimental protocol and plots of global cysteine reactivity. h, Log10 fold-change in protein abundance between heavy- and light-isotopically labeled HEK293T cells treated with KB02-JQ1 (20 µM, heavy), KB02-SLF (2 µM, heavy) or DMSO (light) for 24 h. The y-axis and x-axis correspond to the average relative log10 abundance (KB02-JQ1/DMSO or KB02-SLF/DMSO) and coefficient of variation, respectively, from two experiments (n = 2 biologically independent experiments). The average relative log10 abundance of each protein is normalized to the average log10 abundance of proteins in control DMSO/DMSO samples (to account for slight deviations in heavy isotope incorporation; Supplementary Dataset 5).

