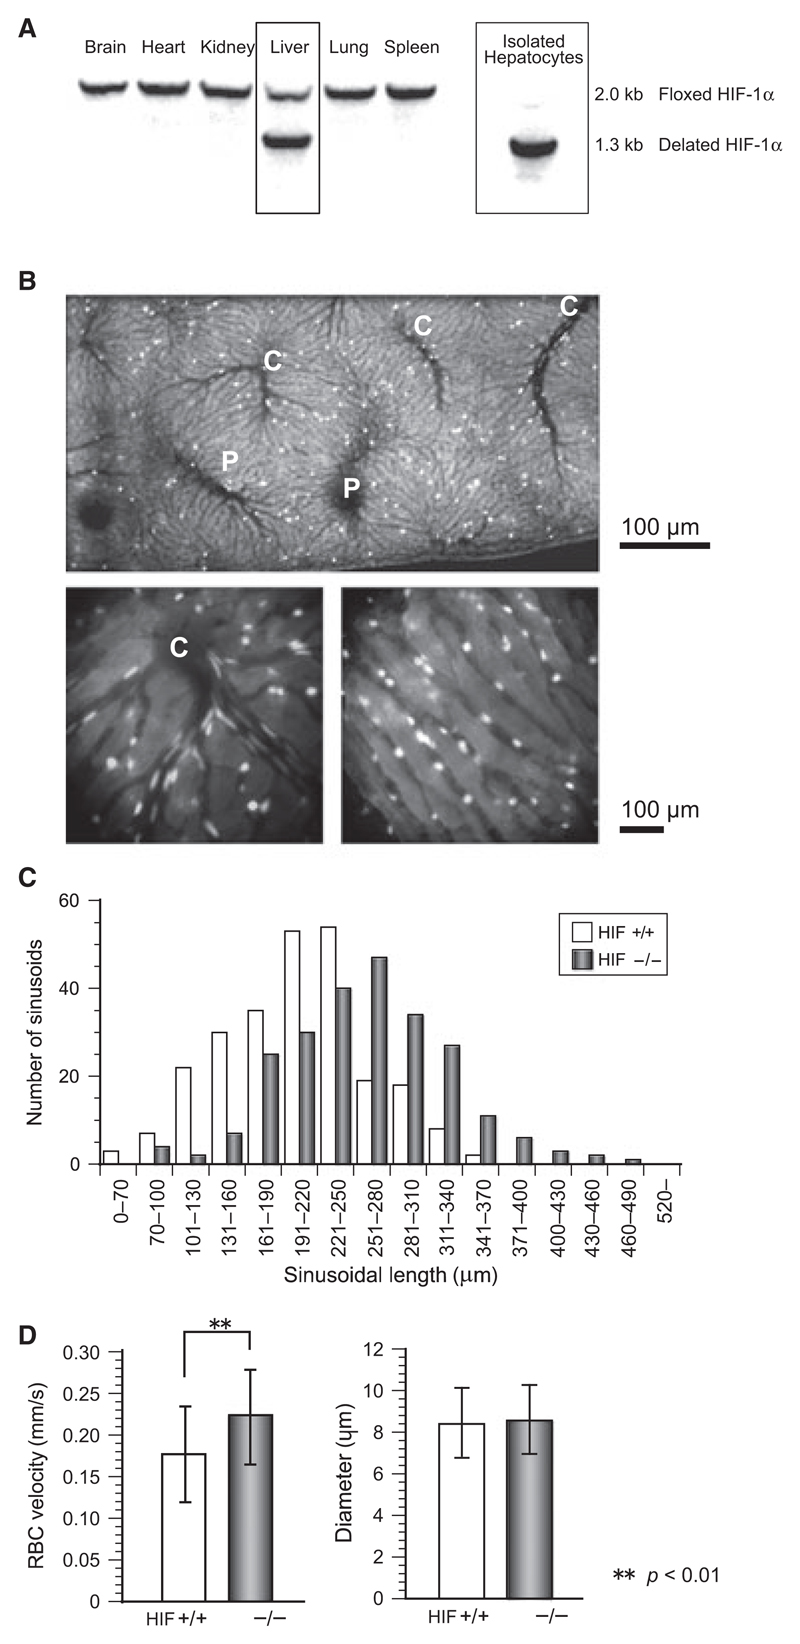
Figure 1.
(A) Southern blotting results of tissue samples from various organs. Only hepatocytes showed deletion of HIF-1α gene. (B) Hepatic microcirculation was visualized using erythrocytes fluorescently labeled with FITC. Flow direction in video helped to identify portal veins, sinusoids, and central venules. “P” and “C” indicate portal veins and central venules. Lower panels are magnified images of central venules (left) and sinusoids (right). (C) Histogram showing elongation of the hepatic sinusoids in knockout mice. The average length (± SD) was 257.7 ± 67.3 μm in HIF−/− mice (n = 239) and 232.4 ± 60.2 in HIF-1α+/+ mice (n = 251). (D) RBC velocity in sinusoids and the sinusoid diameter were measured under a high-powered microscope, and the flow velocity in HIF−/− (0.22 ± 0.06 mm/sec) was significantly greater than that in control mice (0.18 ± 0.06 mm/sec) (p < 0.01).

