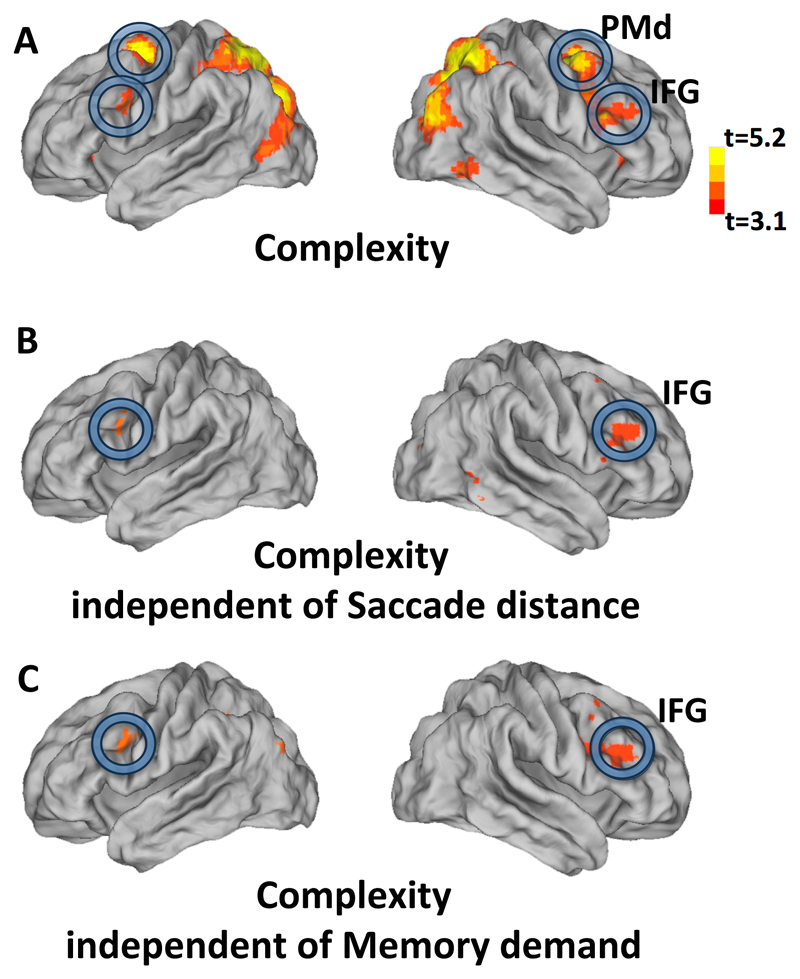
Figure 3. Brain activation related to sequence complexity.
(A): Brain regions showing significant correlations of BOLD signal with the complexity (minimal description length) of each sequence (group analysis thresholded at t > 3.1, cluster-level FDR p < 0.05 corrected) projected on lateral view of a slightly inflated brain. (B, C) Same map after exclusion of the voxels that were above threshold (p < 0.05, uncorrected; “exclusive masking”) in the brain map for saccade distance (Fig. S3, B) or memory demand (the contrast of 4points versus 2points sequence, Fig. S3, C) respectively. Abbreviations: PMd, dorsal premotor; IFG, inferior frontal gyrus.

