
Figure 2.
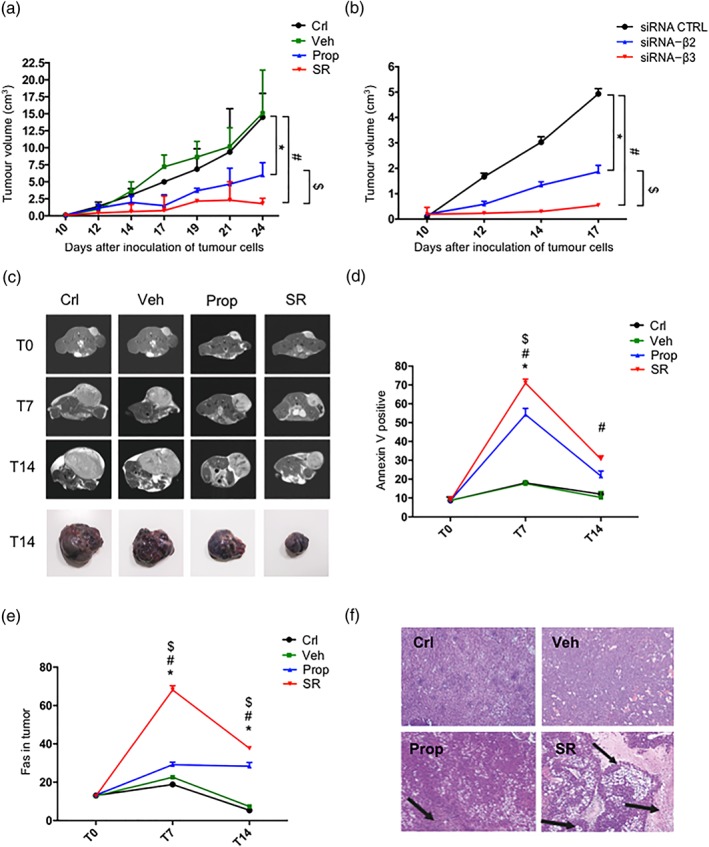
(a) Tumour growth rate in control‐ (Crl), vehicle‐ (Veh), propranolol (Prop)‐, and SR59230A (SR)‐ treated mice (n = 6). (b) Tumour growth rate in siRNA‐CTRL, siRNA‐β2, and siRNA‐β3 treated mice (n = 6). (c) MR images of mouse ventral section in control, vehicle‐, propranolol‐, and SR59230A‐treated mice (n = 6). (d) FACS analysis of AnnexinV positive cells in control, vehicle‐, propranolol‐, and SR59230A‐treated mice (n = 6). (e) FACS analysis of Fas marker expression in tumours of control, vehicle‐, propranolol ‐, and SR59230A‐treated mice (n = 6). (f) Representative fields of haematoxylin–eosin (H&E) staining at T14 in control, vehicle‐, propranolol‐, and SR59230A‐treated mice (n = 6). *P < 0.05 Prop‐ (or siRNA‐β2) compared with Veh‐; # P < 0.05 SR‐ (or siRNA‐β3) compared with Veh‐; $ P < 0.05 SR‐ (or siRNA‐β3) compared with Prop‐ (or siRNA‐β2)