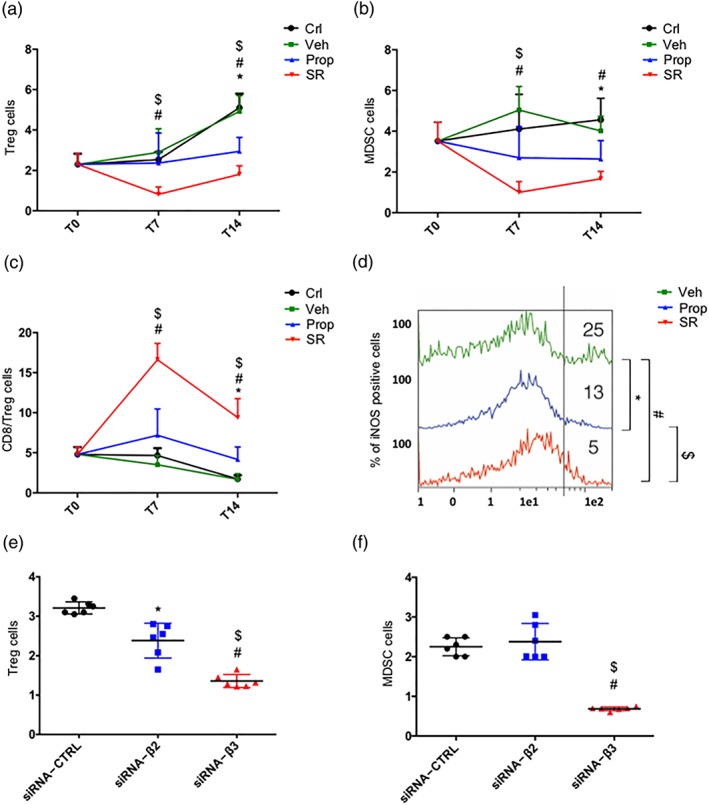
Figure 4.

(a) FACS analysis and quantification at T7 and T14 of Treg (CD25+/CD127− gated on CD45+/CD4+). (b) FACS analysis and quantification at T7 and T14 of MDSC (in CD11b+, GR1+ gated on CD45+). (c) FACS analysis and quantification at T7 and T14 of CD8+/Treg ratio. (d) iNOS expression in MDSC. (e) FACS analysis and quantification at T14 of Treg (CD25+/CD127− gated on CD45+/CD4+) in siRNA‐CTRL, siRNA‐β2, and siRNA‐β3 treated mice (n = 6). (f) FACS analysis and quantification at T14 of MDSC (in CD11b+, GR1+ gated on CD45+) in siRNA‐CTRL, siRNA‐β2, and siRNA‐β3 treated mice (n = 6). *P < 0.05 propranolol (Prop)‐ (or siRNA‐β2) compared with Veh‐; # P < 0.05 SR59230A (SR)‐ (or siRNA‐β3) compared with Veh‐; $ P < 0.05 SR‐ (or siRNA‐β3) compared with Prop‐ (or siRNA‐β2)
