Figure 4.

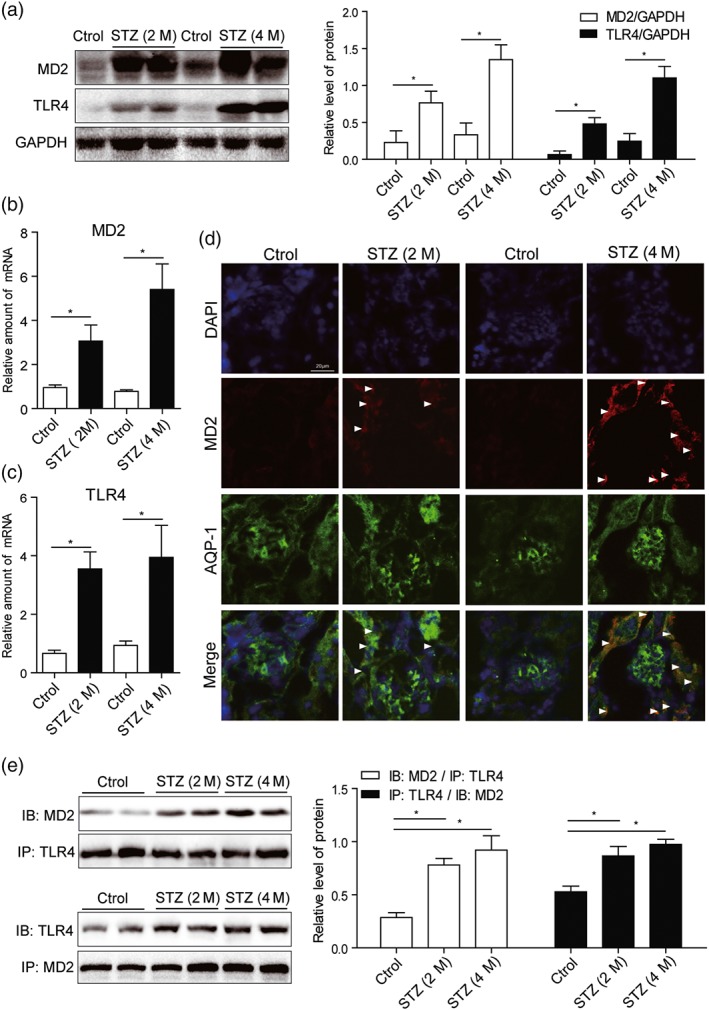
MD2 is overexpressed and activated in diabetic mouse kidney. Mice were treated with a single i.p. injection of STZ to induce Type 1 diabetes and then were fed with standard diet for 2 or 4 months to develop nephropathy. Kidney tissues were collected at the time of killing. (a) Representative western blot of MD2 and TLR4 proteins in kidney tissues. Densitometric quantification is shown in right (n = 7 mice per group). (b and c) Real‐time qPCR assay of MD2 and TLR4 mRNAs in kidney tissues (n = 7 mice per group). (d) Kidney tissue sections from each group were double‐stained with MD2 and AQP‐1 immunofluorescence antibodies (with DAPI staining for nuclei). Representative images from n = 7 per group were shown. Scale bar: 20 μm. White arrows indicate fluorescence‐positive MD2 protein. (e) MD2 is activated in diabetic kidney. Shown are representative western blots (IBs) from the co‐precipitation (IPs) studies for MD2/TLR4 complex formation. Densitometric quantification is shown in right (n = 7 mice per group). Bar graph shows mean values ± SEM; *P < .05, significantly different as indicated
