
Figure 7.
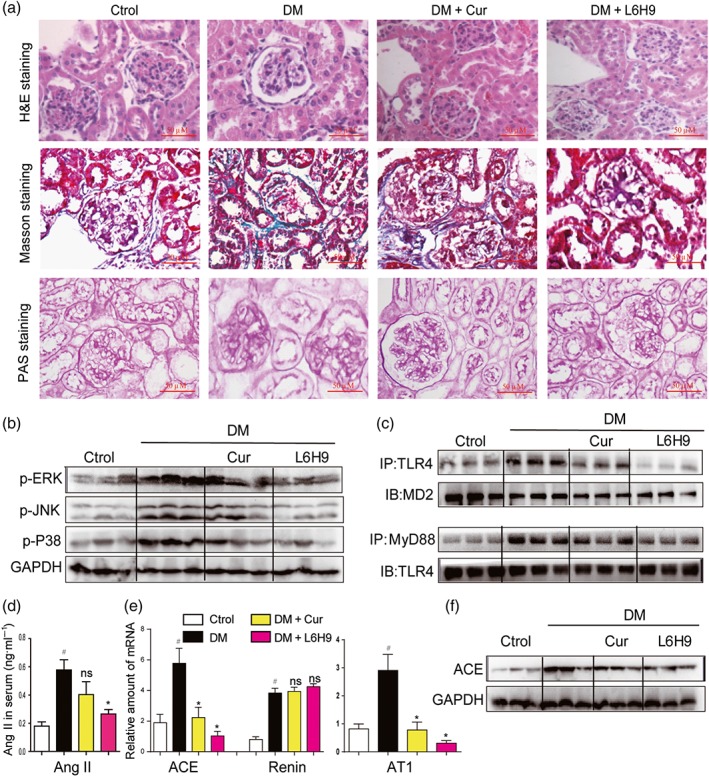
Oral administration of the MD2 inhibitor L6H9 ameliorated diabetic (DM)‐induced kidney damage in C57BL/6 mice. (a) Representative light micrograph of histochemical assessment of kidney tissues: haematoxylin and eosin (H&E) staining, Masson's trichrome staining, and PAS staining for detection of connective tissue; 400× magnification. (b) Representative western blot analysis of phosphorylated MAPKs in kidney tissues; n = 3 mice in each group. (c) Representative co‐immunoprecipitation analysis of TLR4‐MD2 and TLR4‐MyD88 bindings in kidney tissues; n = 3 mice in each group. (d) Serum Ang II level was detected by corresponding kit. (e) Kidney tissue content of RAS‐related genes was determined by real‐time quantitative‐PCR assay. (f) Representative western blot analysis of ACE in kidney tissues; n = 3 mice in each group. Bar graph shows mean values ± SEM; n = 8 in four groups, # P < .05, significantly different from Control group; *P < .05, significantly different from DM group; ns = not significantly different from DM group