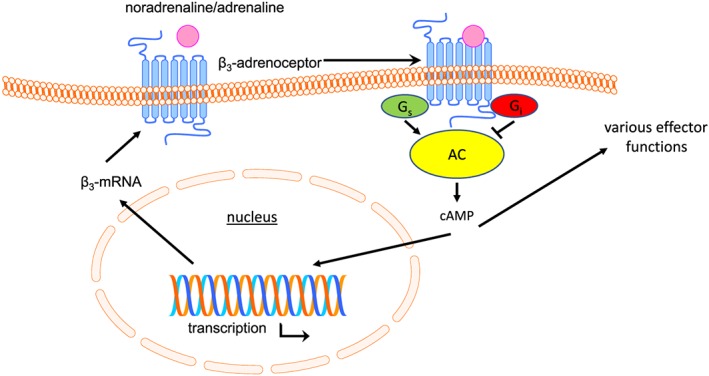
Figure 3.

Schematic diagram of key aspects of β3‐adrenoceptor function and regulation. In many if not most tissues and cell types, these do not change upon prolonged agonist exposures, but in some, each of them may decrease (except for Gi, which may increase). For details, see main text
