
Figure 3.
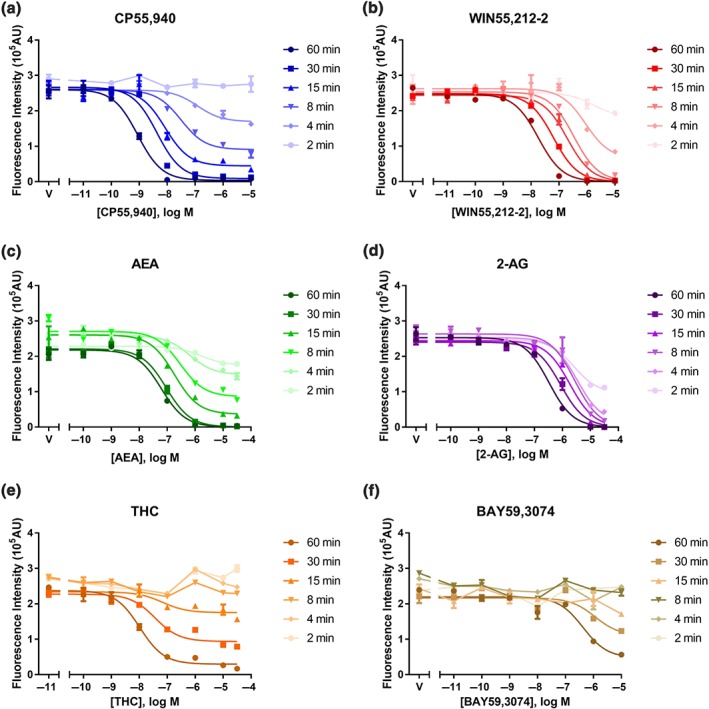
Representative “live‐at‐start” internalisation concentration–response curves, showing agonist‐induced internalisation of surface 3HA‐hCB1 in HEK cells upon stimulation for six different time points with CP55,940 (a), WIN55,212‐2 (b), AEA (c), 2‐AG (d), THC (e), and BAY59,3074 (f). Symbols represent raw data (demonstrating mean ± SEM of technical duplicate) and the curves shown are classic three‐parameter Emax model fits (n H constrained to one)