
Figure 7.
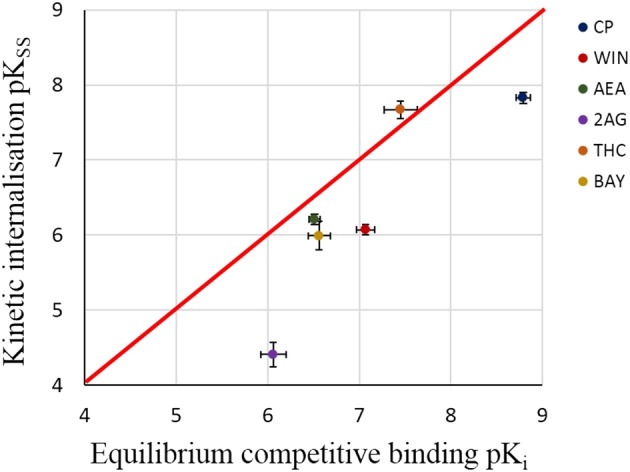
Correlation between pKSS derived from kinetic internalisation assay in the whole cells and pKi derived from equilibrium competitive binding assay in membrane homogenates. Here, the red line indicates the identity line and the error bar indicates the standard error. Data generally fall below the line of unity as would be expected if the quasi‐steady state assumption is valid. The data for pKSS are presented in Table 3 and the data for pKi are included in Table S1