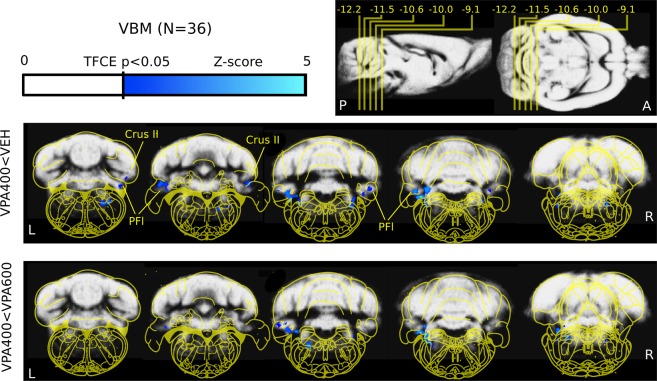
Figure 1.
Decreased cerebellar and brainstem gray matter density revealed by voxel-based morphometry analysis. Evidence of cerebellar (crus II and paraflocculus) and brainstem (ventral nu. lat. lemniscus) lower focal gray matter density in the VPA400 group compared to both the VEH (top) and the VPA600 (bottom) groups (measurement 1). Compared to the VEH group, no decreases in VPA600 group and no increases in either of the VPA groups were observed. These results, together with the tissue volumetry analysis (Fig. 3), show that both VPA doses induced smaller whole brain volume while only the 400 mg/kg VPA dose induced detectable, focal localized cerebellar and brainstem gray matter alterations. On the top right of the figure, the position of slices (and their distance from bregma in mm) are shown on sagittal and horizontal planes. The colorbar represents Z-score (Gaussianized T-score) values of the parametric images (TFCE enhanced FDR-corrected significance threshold of P = 0.05). The slices highlight significant clusters (meaning that there are no significant changes in the cerebrum). Parametric images are overlaid on the study specific gray-matter probability map. Yellow overlay: Paxinos rat brain atlas. Images are shown in neurological convention (left-is-left; A: anterior, P: posterior, L: left, R: right; Crus II: crus II; PFI: paraflocculus).

