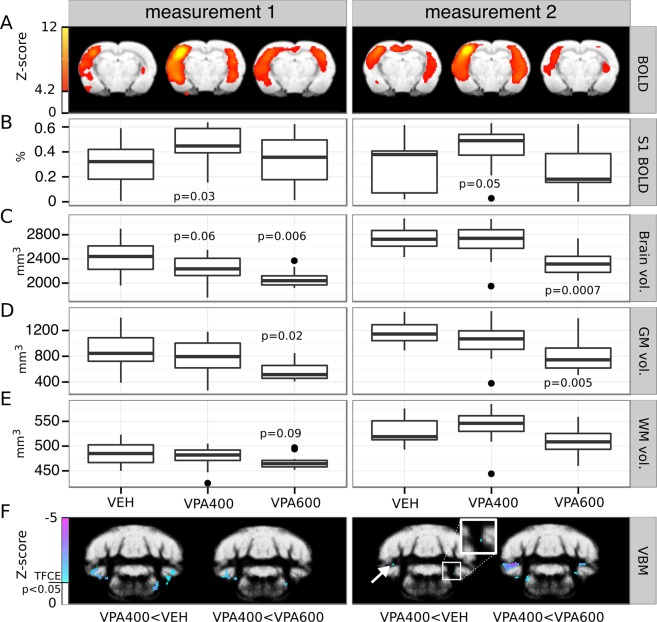
Figure 3.
Persevered prenatal valproate-induced alterations demonstrated by a repeated MRI assessment of brain structure and function. (A) fMRI statistical parametric maps (at a coronal slice 2.8 mm from bregma in the posterior direction) of group-mean BOLD responses to whisker stimulation (right side) in the three experimental groups measured with one month difference. (B) Boxplots represent the average BOLD response in an unbiased somatosensory ROI (pooled-group mean activation Z-score > 9). Note the reproducible hyperactivation in the contralateral somatosensory cortex in the VPA400 group, in both measurements. (C,D,E) Boxplots depict the volume (mm3) of the whole brain, gray matter and white matter, respectively. The VPA600 group exhibits a significantly decreased whole brain volume and gray matter volume in both measurements, despite the overall increase in brain volume. (F) Bilateral cerebellar and brainstem gray matter density decreases found by VBM in the VPA400 group compared to both the VEH group (left image in both panels) and the VPA600 group (right image in both panels), consistently in both MRI measurements. Inset zooms into small details of the image, revealing a spatially limited cluster of difference. Colorbars represent Z-score values. Statistical images are thresholded at a corrected threshold of FWER P < 0.05. Images are displayed in neurological convention (left-is-left). Boxes in the boxplots represent the 75th, 50th (median), and 25th percentile, whereas whiskers represent either the extrema or twice the interquartile range. Observations falling outside the 2*IQR range are represented by points. P-values lower than 0.1 (contrasting VPA groups to the VEH) are shown at the boxplots.

