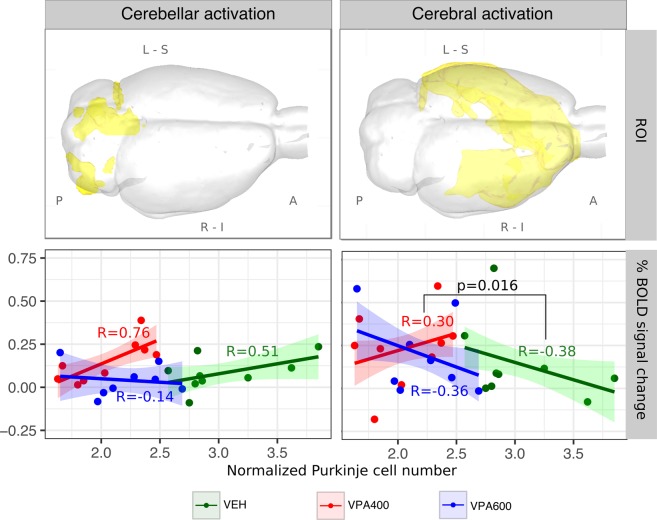
Figure 6.
Atypical relationship between BOLD response and Purkinje cell number in cerebellar and cerebral ROIs of the pooled activation maps, suggesting probable malfunction of reciprocal cerebrocerebellar circuits. ROIs (visualized in 3D glass-brains) were defined based on the F-contrast representing the unbiased, pooled activation map, thresholded at FWER p < 0.05 and divided into cerebellar (left) and cerebral (right) components. Analysis of the cerebellar ROI (left column) revealed a general positive correlation between frontal BOLD response and Purkinje cell number in the VEH group. No such correlation was observed in the VPA600 group. Despite the remarkable decrease in Purkinje cell number in the VPA400 group, BOLD responses, in terms of both magnitude and correlation with Purkinje cell number, were comparable to those of the controls. In the cerebral ROI (right panel), both the VEH and the VPA600 groups exhibited a significant negative correlation between BOLD response and Purkinje cell number. Interestingly, the correlation was positive in the VPA400 group, which possibly indicates the presence of an atypical cerebrocerebellar circuit in this VPA group. Abbreviations: A: anterior, P: posterior, L: left, R: right, S: superior, I: inferior.

