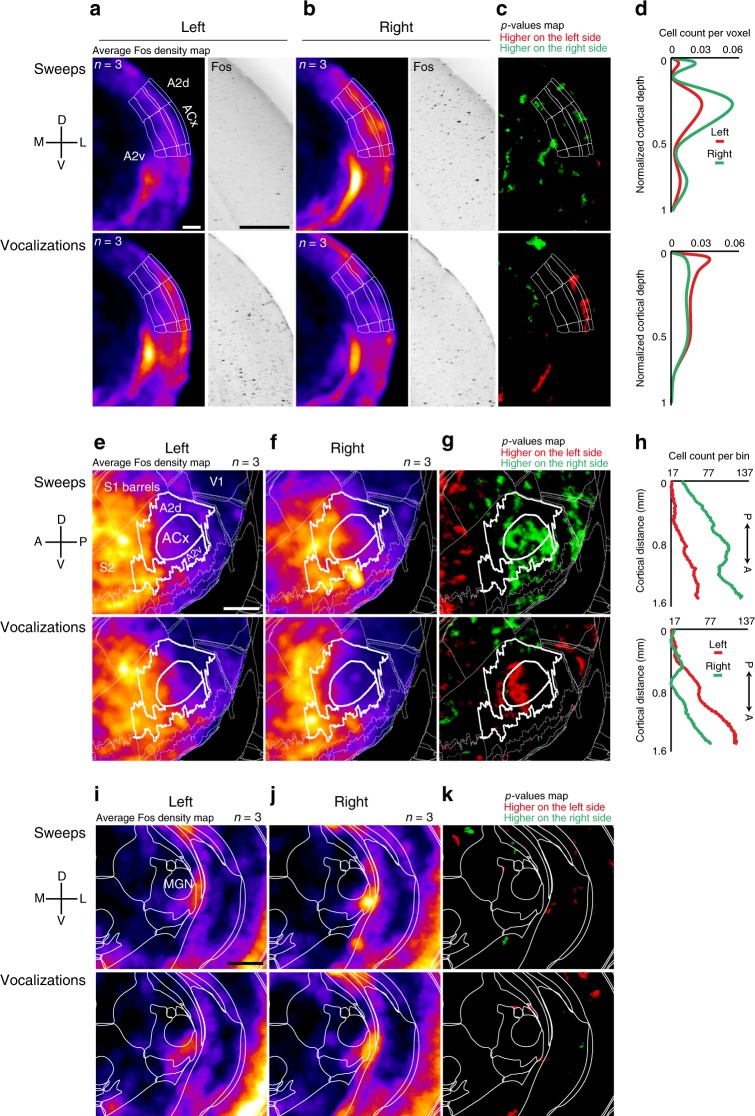
Fig. 1.
Sweeps and mouse vocalizations evoke lateralized activation in the ACx. a Coronal plane showing average Fos density (left) and Fos-positive cells stack (right) for sweeps (top, n = 3 mice) and vocalizations (bottom, n = 3 mice) in the left ACx; scale bar 0.5 mm. b Same as (a) but showing the right ACx. c Maps of statistically significant differences in activation between the left and right hemispheres. Sweeps evoked higher activation in the right ACx (top), and vocalizations evoked higher activation in the left (bottom). d Laminar distribution of cell count per imaging voxel (25 μm3). e, f Lateral cortical projection showing average Fos density for sweeps (top, n = 3 mice) and vocalizations (bottom, n = 3 mice) in the left and right hemispheres (respectively); scale bar 1 mm. g Maps of statistically significant differences in activation between the left and right cortical projections. Sweeps evoked higher activation in the right ACx (top), and vocalizations evoked higher activation in the left (bottom). h Distribution of cell count along the tonotopic axis. The y axis represents the number of cells in superficial layers in neighborhoods of 190 µm around each point on the line drawn. i, j Coronal plane showing average Fos density in the auditory thalamus (MGN), for sweeps (top, n = 3 mice) and vocalizations (bottom, n = 3 mice) in the left and right hemispheres (respectively); scale bar 1 mm. k Statistical maps showing no significant difference in activation between the left and right MGN projections

