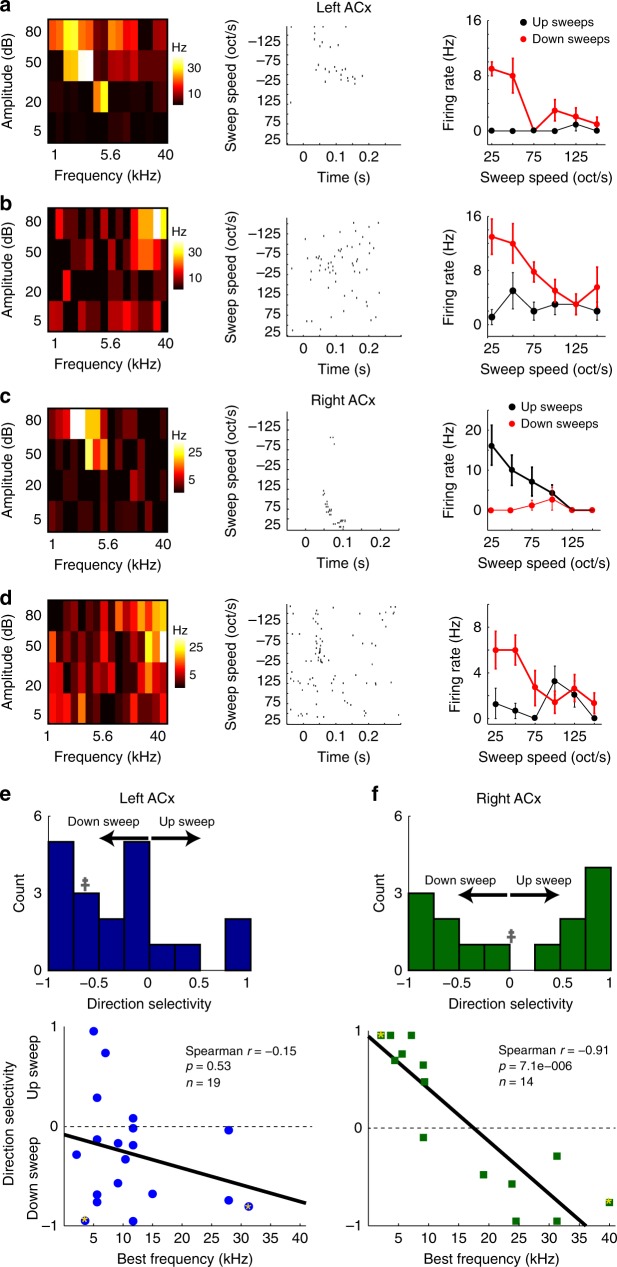
Fig. 2.
Hemispheric differences in sweep direction selectivity. Cell-attached recordings showing tone and sweep selectivity in L2/3 neurons. a Frequency response area (FRA, left), spike rasters of responses to sweeps (middle), and sweep selectivity (right) of a single neuron in the left ACx. The neuron’s BF = 3.4 kHz and had a down-sweep preference. b Left ACx neuron with BF = 31.3 kHz and a down-sweep preference. c Right ACx neuron with BF = 3.4 kHz and an up-sweep preference. d Right ACx neuron with BF = 40 kHz and a down-sweep preference. All data are presented as mean ± SEM. e, f Distribution of sweep direction selectivity (top panels), and direction selectivity-best frequency dependence (bottom panels) in the left and right ACx. Double cross in the top panels represents the skewness of the distribution. Points with asterisks correspond to the cells shown a–d, and solid black lines are best linear fits

