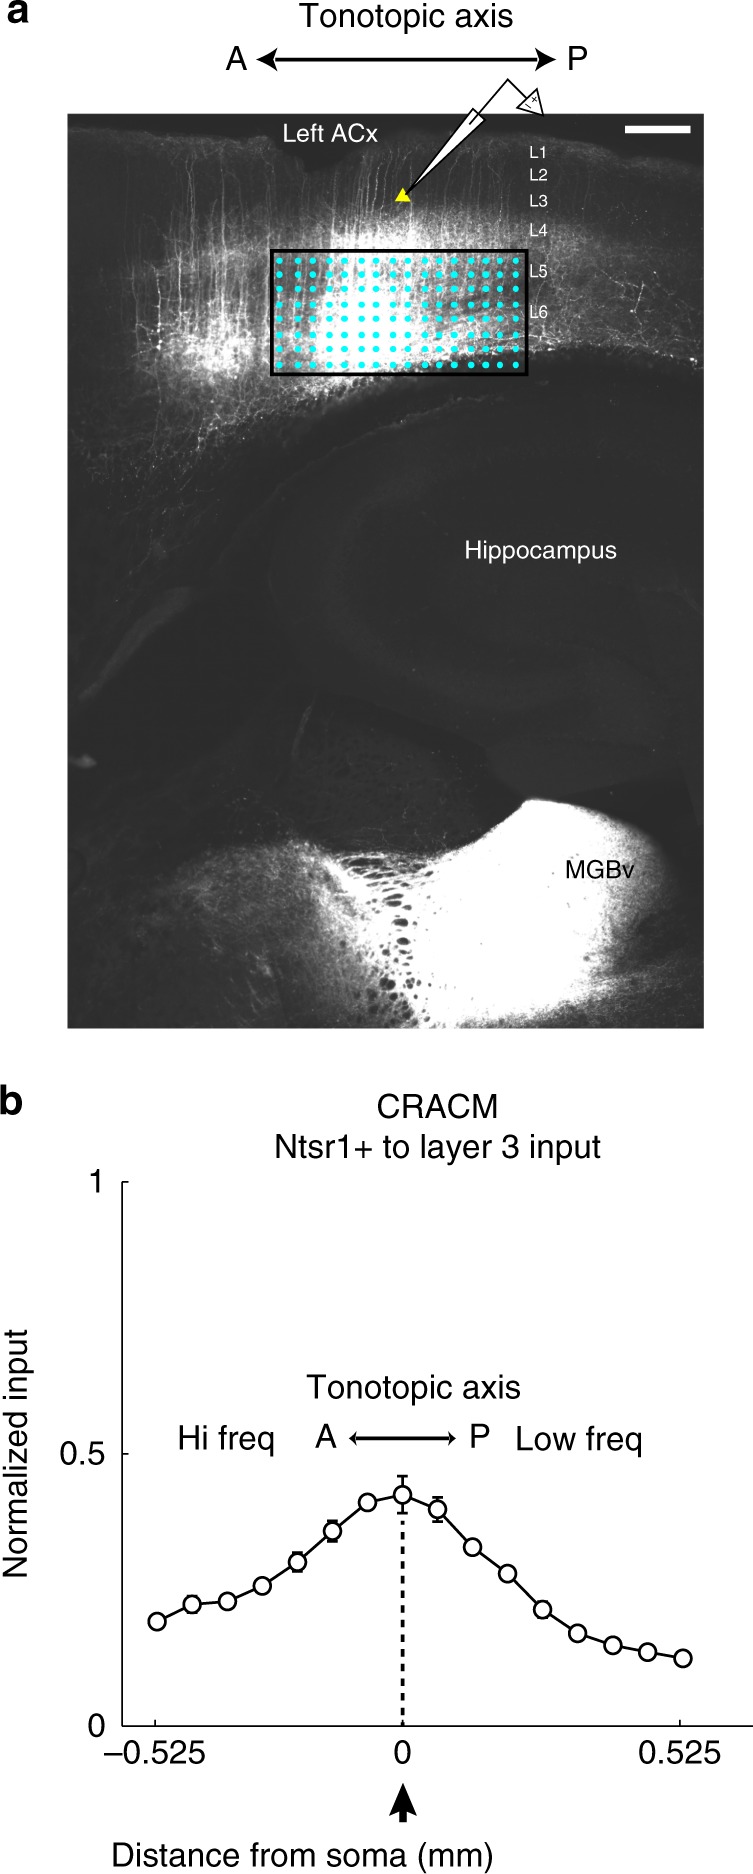
Fig. 6.

Channelrhodopsin-assisted mapping of L6-Ntsr1 input to L3. a Confocal image of channelrhodopsin expression in the auditory cortex. Axons are clearly seen in the auditory thalamus (MGBv). Neurons in L3 centered on the injection bolus were targeted for whole-cell recordings. Scale bar 0.3 mm. b Using minimal laser stimulation (at threshold to evoke a measureable postsynaptic response), we obtained the spatial profile of L6-Ntsr1 input to L3. Normalized columnar average of L6-Ntsr1 input to cells in L3 (n = 10) revealed input largely centered on the somata of the cells recorded. All data are presented as mean ± SEM
