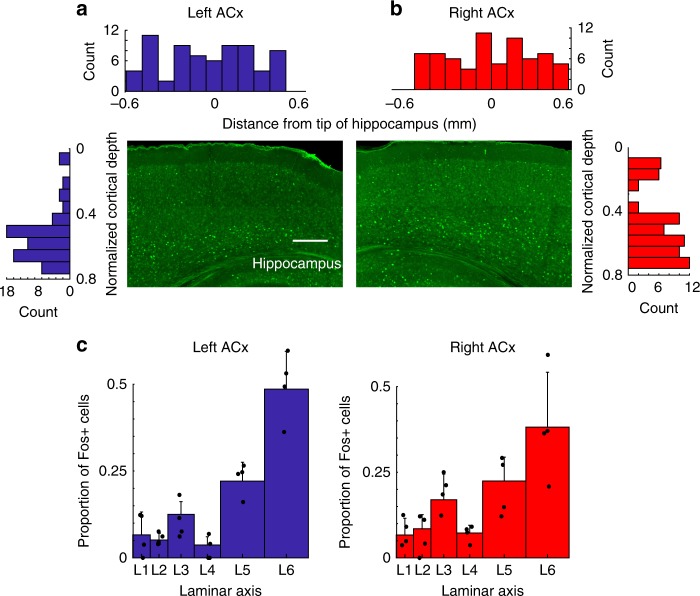
Fig. 8.
Hearing onset Fos activity in response to vocalizations. a, b Quantification of immuno Fos staining data at hearing onset (P12–14) showing that there is no difference in the number of Fos-positive neurons between the left and right ACx. Scale bar 0.2 mm. c Population plots showing that although there is no difference in the total number of active cells between the hemispheres, there is a significant difference in the activation of superficial and deep layers (n = 3 mice). All data are presented as mean ± SEM

