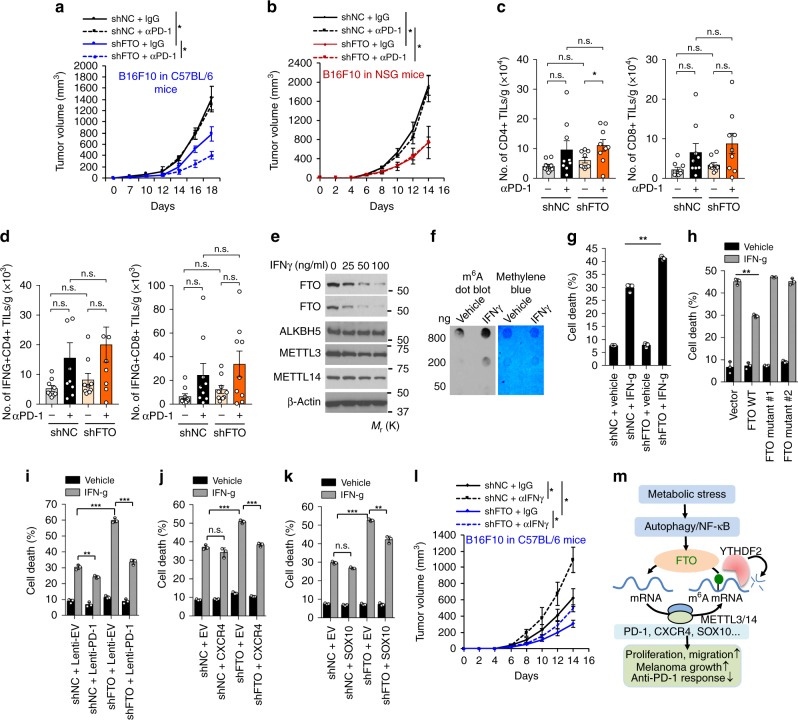
Fig. 8.
Role of FTO in melanoma cell response to anti-PD-1 antibody in vivo or to interferon gamma (IFNγ) in vitro. a, b Tumor growth kinetics of control or FTO-knockdown B16F10 cells in C57BL/6 mice (a) and NSG mice (b) treated with anti-PD-1 or isotype control antibody (n = 4–6). *P < 0.05. c, d Flow cytometric analysis of the number of CD4+ and CD8+ TILs (c) and IFNγ-producing TILs (d) per gram of tumor tissue (n = 9). Mann–Whitney U-test. *P < 0.05. n.s., not significant. e Immunoblot analysis of FTO, ALKBH5, METTL3, METTL14, and GAPDH in Mel624 cells treated with or without IFNγ (100 ng/ml) for 24 h. f m6A dot blot assays using total RNA of Mel624 cells treated with or without IFNγ (100 ng/ml) for 24 h. g Apoptosis assay in Mel624 cells with or without FTO knockdown and treatment with or without IFNγ (50 ng/ml) for 48 h. h Apoptosis assay in Mel624 cells overexpressing vector, FTO WT, mutant 1, or mutant 2, and treated with or without IFNγ (50 ng/ml) for 48 h (n = 3). **P < 0.01, Student’s t-test. i–k Apoptosis assay in Mel624 cells with or without FTO knockdown overexpressing vector or PD-1 (i), CXCR4 (j), or SOX10 (k) treated with or without IFNγ (50 ng/ml) for 48 h (n = 3). *P < 0.05; **P < 0.01; ***P < 0.001; Student’s t-test. l Tumor growth of control or FTO-knockdown B16F10 cells in C57BL/6 mice treated with the anti-IFNγ antibody or isotype control IgG (n = 4–6). Data are shown as mean ± S.E. (a–e, and l), or mean ± S.D. (g–k) (n ≥ 3). *P < 0.05; **P < 0.01; ***P < 0.001; Student’s t-test. m Proposed model of the regulatory and functional role for FTO in melanoma pathogenesis and response to anti-PD-1 blockade

