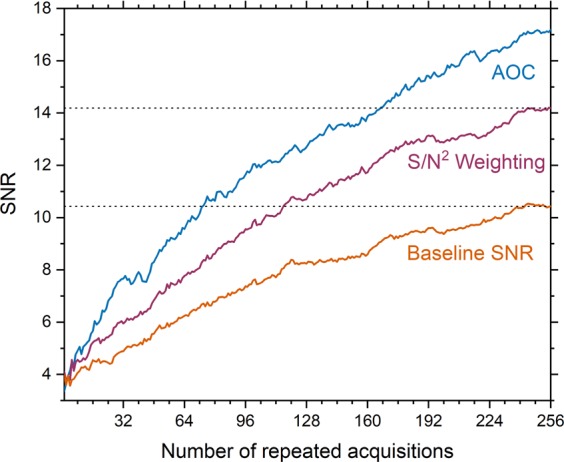
Figure 5.

SNR as a function of the number of repeated acquisitions. The mean SNR obtained using AOC and S/N2 Weighting for PUFA spectra acquired from five patients is plotted as a function of the number of repeated acquisitions. Baseline SNR is also shown. The dotted line shows the maximum average baseline SNR (SNR = 10.4) and maximum average SNR using S/N2 Weighting (SNR = 14.1) after averaging for 256 acquisitions. To achieve the same SNR using AOC, the acquisition time can be reduced to 28% (6–43%) compared to baseline. If noise correlation is not ignored, the acquisition time can be reduced to 68% (46–72%) (1.5 times faster) compared to S/N2 Weighting. Values are given as median and range in parenthesis. Standard errors for each line are shown in Supplementary Fig. S2a,b.
