Fig. 2.
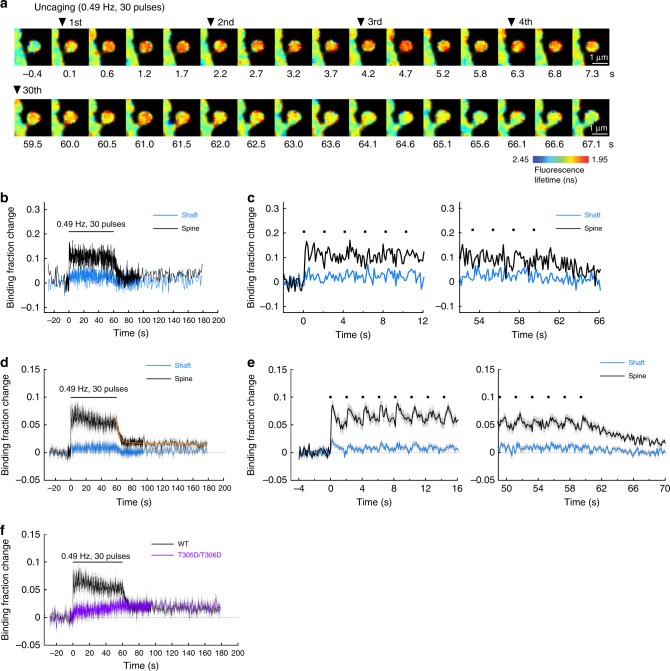
CaMKIIα-CaM association during sLTP induction. a Representative fluorescence lifetime images of CaMKIIα-CaM association sensor during glutamate uncaging at 0.49 Hz. Warmer colors indicate lower fluorescence lifetime, corresponding to a higher binding fraction of mCherry-CaM to mEGFP-CaMKIIα. Scale bar, 1 µm. b Time course of CaMKIIα-CaM association in a stimulated spine (black) and nearby dendrite (blue). Analyzed from images in a. Black dots represent uncaging pulses. c Expanded view of the rising phase (left) and the decay phase (right) of b. d Averaged change in CaMKIIα-CaM association in stimulated spines (black) and nearby dendrite (blue) (n = 27 spines/9 neurons). The orange curve indicates the decay of binding fraction change obtained by curve fitting of a double-exponential function: B(t) = B0 [Pfast·exp(–t/τfast) + Pslow·exp(–t/τslow)], where B0 is the initial binding fraction change, τfast and τslow are the fast and slow decay time constants and Pfast and Pslow are the respective populations. The time constants are obtained as τfast = 3.2 ± 0.6 s (Pfast = 71%) and τslow = 572 ± 843 s (Pslow = 29%). e Expanded view of the rising phase (left) and the decay phase (right) of d. f Average time course of CaMKIIα-CaM association for a mutant mEGFP-CaMKIIαT305D/T306D in which the Thr305 and Thr306 are mutated to aspartate. The mutation precludes Ca2+/CaM binding in the stimulated spine during glutamate uncaging at 0.49 Hz (purple; n = 34 spines/5 neurons). The data for CaMKIIαWT (black) are from c for the comparison. All data are shown in mean ± sem, and sem of time constants is obtained by bootstrapping

