Fig. 5.
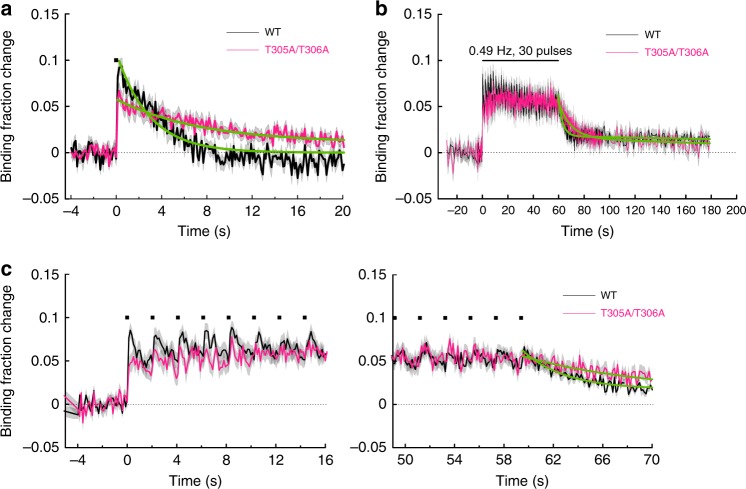
Association of CaMKIIαT305A/T306A-CaM during sLTP induction. a Averaged change in CaMKIIαT305A/T306A-CaM association in a stimulated spine (magenta; n = 34 spines/6 neurons) in response to a single glutamate uncaging pulse (black square). The green curve on CaMKIIαT305A/T306A is obtained by curve fitting of an exponential function: B(t) = B0 exp(–t/τ). The dissociation time constant is obtained as τ = 7.5 ± 1.1 s. Inset is a expanded view. The data and fitted curve for CaMKIIαWT are from (Fig. 3c) for the comparison. b Averaged change in CaMKIIαT305A/T306A-CaM association (n = 27 spines/8 neurons) during glutamate uncaging at 0.49 Hz. The green curve indicates the decay of binding fraction change obtained by curve fitting of a double-exponential function: B(t) = B0 [Pfast·exp(–t/τfast) + Pslow·exp(–t/τslow)]. The time constants are obtained as τfast = 9.3 ± 1.8 s (Pfast = 71%) and τslow = 249 ± 229 s (Pslow = 29%). The data and fitted curve for CaMKIIαWT are from (Fig. 2d) for the comparison. c Expanded view of the initial phase (left) and the late phase (right) in b

