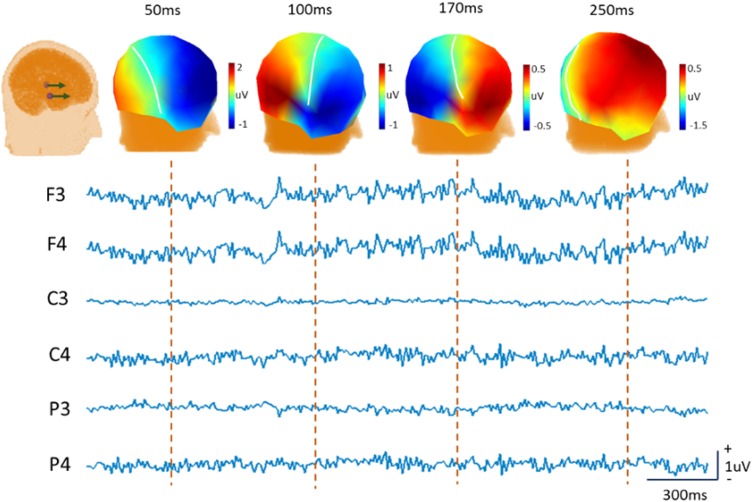
Fig. 2.
Simulated data shows the inconsistency of zero potential line. The heads show the position of two dipoles and the topographic maps at four time-samples, where the white curve over the scalp is the zero-potential curve which is dynamical momently. The traces show the EEG temporal processes over six electrodes

