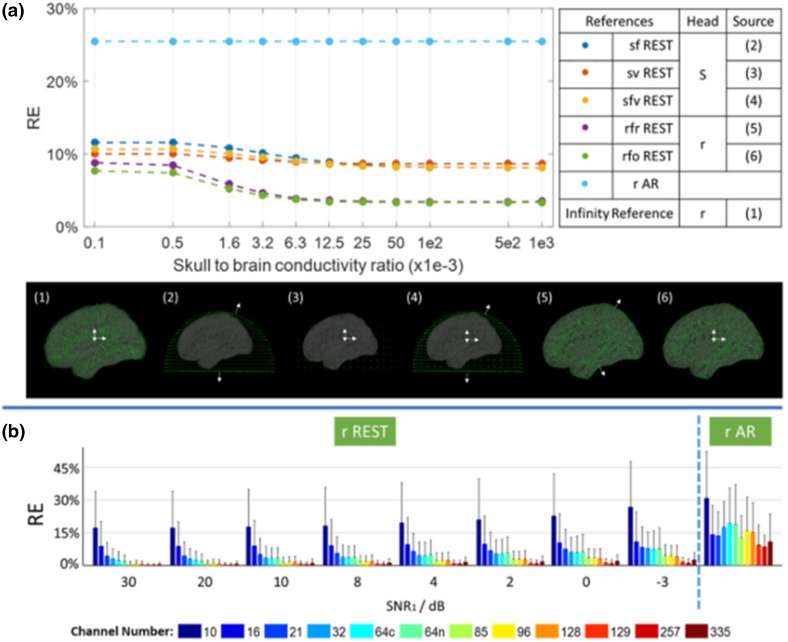
Fig. 4.
Simulated data tests the robustness of REST to errors in head models. a RE—the relative error; 1e2, 5e2, 1e3, and 1e-3 mean 100, 500, 1000, 0.001, respectively. b The numbers in the x-axis are the SNRs in dB; gray bars—the standard deviation of the REs over different sources.
(Reproduced from Hu et al. 2018b)

