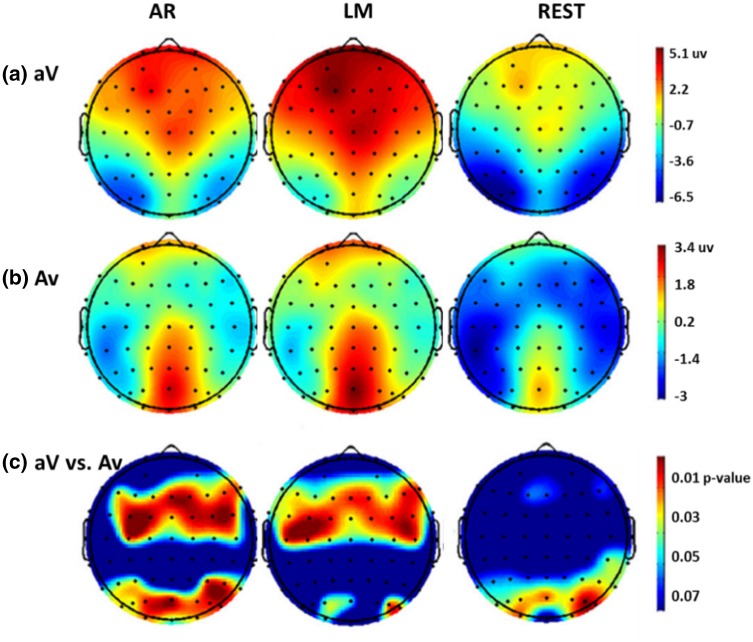
Fig. 9.
Recorded data derives the potential topographies and SPSM of N1 peaks (at 170–190 ms). a Potential topographies of attending V in an AV stimulus (aV), at 170–190 ms after the stimulus onset; b Potential topographies of attending A in an AV stimulus (Av), at 170–190 ms after the stimulus onset; and c SPSM (aV vs. Av) at 170–190 ms
(Reproduced, with permission, from Tian and Yao 2013)

