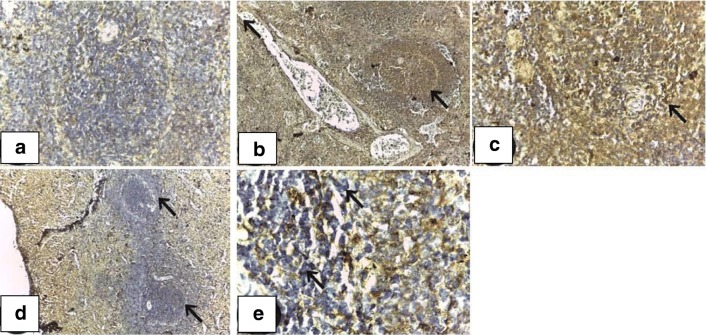
Fig. 2.
Immunohistochemical profile of caspase-3 expression in spleen in various experimental groups. a A section of spleen of the control group showing negative caspase-3 immunoreactivity (caspase-3; ×100). b A section of spleen of the cisplatin-treated group showing intense caspase-3 reaction expressed in white and red pulp (caspase-3; ×100). c A section of spleen of the cisplatin-treated group showing intense caspase-3 reaction expressed in white and red pulp (caspase-3; ×400). d A section of spleen of the cisplatin-and Immulant-treated group showing mild to negative caspase-3 immunohistochemical expression (caspase-3; ×100). e A section of spleen of the Immulant-treated group showing negative caspase-3 immunohistochemical expression (caspase-3; ×1000)

