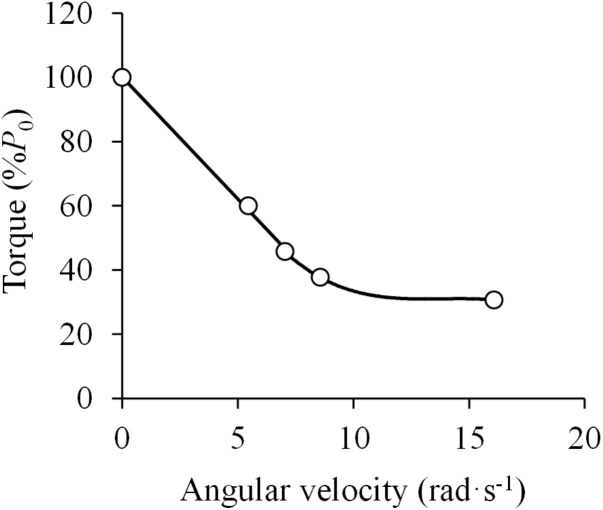
FIGURE 3.
Force (torque)-velocity (angular velocity) relationship. Data were obtained from Figure 8 in Dern et al. (1947) using specialized software (ImageJ 1.51q8, NIH, United States). This modified version represents the force-velocity relationship of a standard subject during elbow flexions. P0 denotes the maximal isometric torque. The attempts with no apparent effect of fatigue were selected. A linear function was fitted to the data above 40% of P0 (F = –7.6 ×V + 100.3; R2 = 0.998) and a third order polynomial function was fitted to the data below 40% of P0 (F = –0.05 ×V3 + 2.00 ×V2 – 27.67 ×V + 158.10; R2 = 1.000) (least squares method in both).

