FIGURE 4.

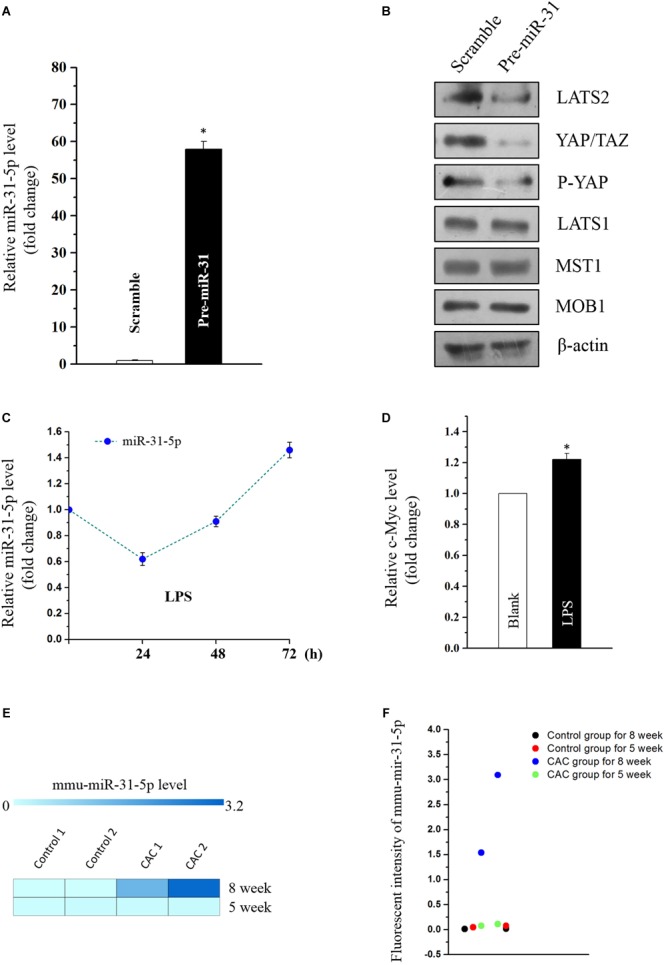
(A) Levels of miR-31-5p 48 h after transfection with pre-miR-31 or control scramble. Values are means ± S.E.M. from three separate experiments. ∗P < 0.05 compared with cells transfected with control scramble. (B) Representative immunoblots of factors in Hippo pathway in cells described in (A). (C) Changes in the level of miR-31-5p as measured by quantitative PCR analysis in Caco2 cells treated with LPS (2 μg/mL) for 0, 24, 48, and 72 h. Values are means ± S.E.M. from three separate experiments. (D) Changes in the level of c-MYC as measured by quantitative PCR analysis in Caco2 cells treated with LPS (2 μg/mL) for 72 h. Values are means ± S.E.M. from three separate experiments. ∗P < 0.05 compared with the blank group. (E,F) Fluorescent intensities of miRNA assay for miR-31-5p in 5 and 8 week CAC models.
