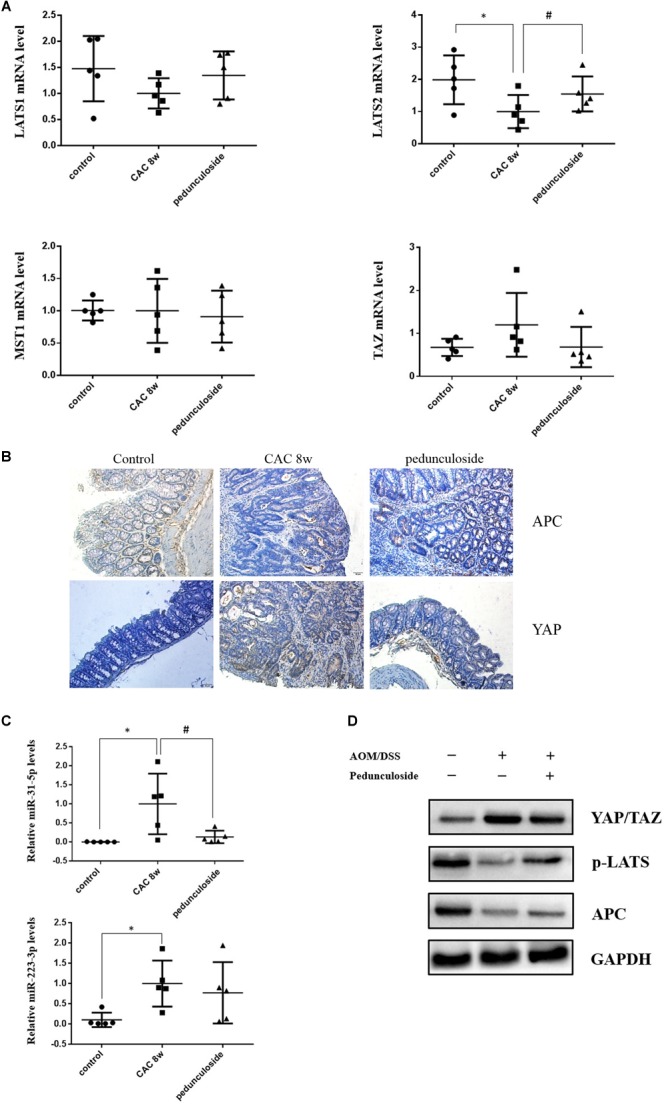
FIGURE 7.

(A) Relative mRNA levels of Lats1, Lats2, TAZ, and MST1 in different group mice colon sample, based on real-time PCR (n = 5). ∗P < 0.05 compared with control group; #P < 0.05 compared with CAC 8 week group. (B) Representative immunostaining for APC and YAP in colon paraffin section (×100). Top left: APC positive staining was mainly distributed in cytoplasm of normal section of colon (brown color); Top middle: In the CAC group, APC positive staining attenuated in the high-grade dysplasia regions (brown color); Top right: APC positive staining increased in the pedunculoside-treated CAC mice (brown color). Bottom left: The YAP level is low in normal group (brown color); Bottom middle: YAP positive staining increased in the nucleus for CAC mice (brown color); Bottom right: YAP positive staining attenuated in the pedunculoside-treated CAC mice (brown color). (C) Real-time PCR data showed miR-31-5p and miR-223-3p levels increased obviously in CAC model group, while miR-31-5p expression decreased after pedunculoside administration (n = 5). ∗P < 0.05 compared with control group; #P < 0.05 compared with CAC 8 week group. (D) Western blot analysis for YAP/TAZ, p-LATS, and APC in different group colon samples. GAPDH was used as loading control (n = 5).
