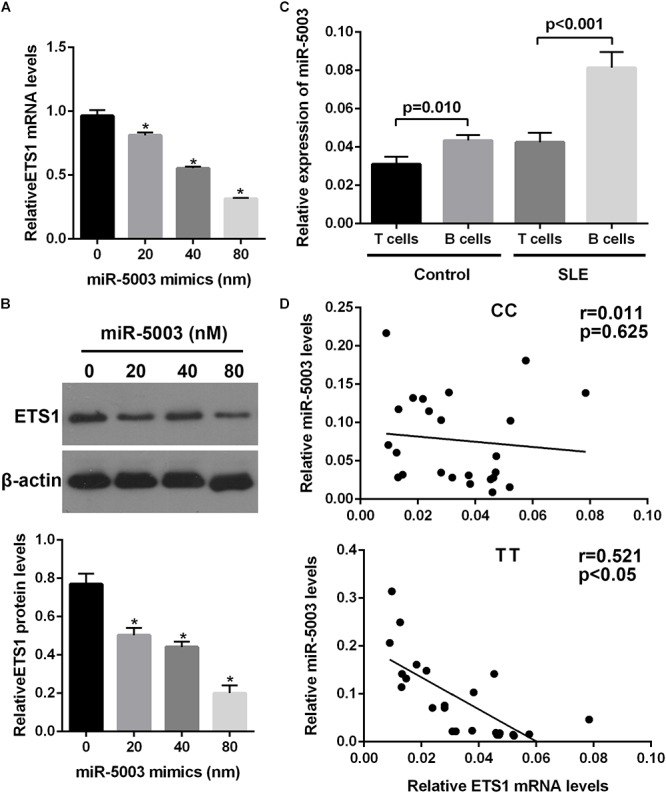
Figure 5.

The effect of the variant allele on ETS1 and miR-5003-3p levels. (A) Real-time quantitative polymerase chain reaction (qPCR) analysis of relative ETS1 mRNA expression in primary B cells transfected with the miR-5003 mimic at the indicated concentrations. (B) Western blot analysis of endogenous ETS1 in primary B cells transfected with miR-5003-3p mimic at the indicated concentrations. (C) miR-5003 levels in B cells or T cells of SLE patients and controls. (D) Correlation analysis of miR-5003 levels and ETS1 mRNA levels in B cells from TT or CC carriers. ∗P < 0.05 vs. miR-NC; n = 3.
