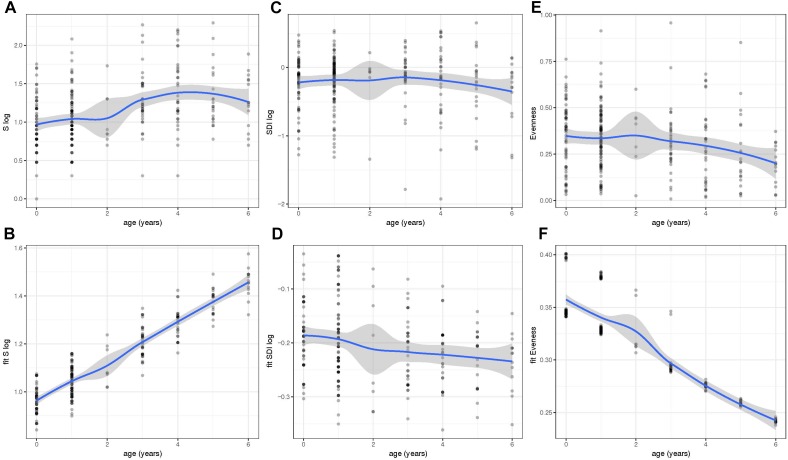
FIGURE 2.
Within-community diversity [Richness (S), Shannon Diversity Index (SDI) and Evenness] analysis in different age groups. Values of S (A), SDI (C), and Evenness (E) were obtained at different ages (0–6 years of age). However, the residuals of the models for S and SDI were not normally distributed and, therefore, were log transformed (A–D). To correct for the dependency nature of the study, linear mixed models including fixed effects were also done and fitted values of S (B), SDI (D), and evenness (F) were plotted throughout time. Richness and Evenness values reveal an increase and decrease in older children, respectively. Fitted values were obtained using the lme4 R package and plots were generated using ggplot2.

