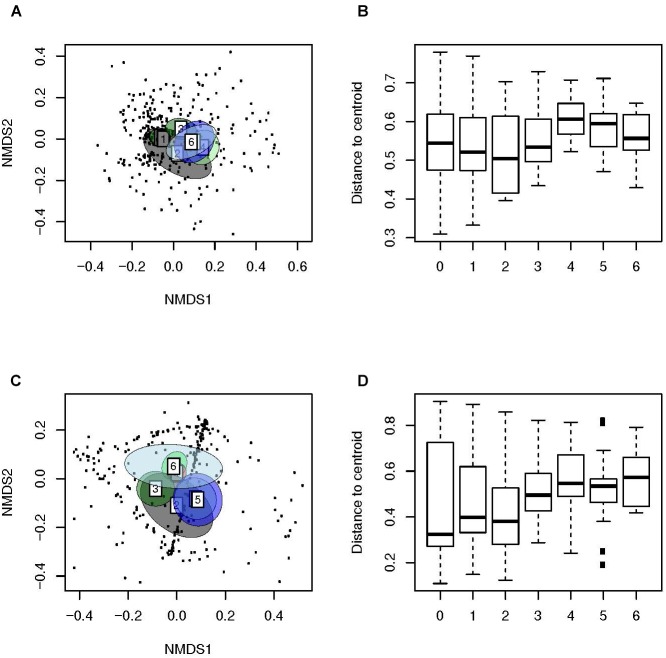
FIGURE 3.
Beta-diversity analyses of samples of children with AOM suggest a more personalized bacterial microbiota with age. Illustrated are (A) Weighted (Ružička) and (C) unweighted (Jaccard) distances in microbiota composition, reduced in a 2D-space by using NMDS, 95% confidence ellipse for the group centroid shown. In addition, shown are the beta-dispersion based on (B) Ružička and (D) Jaccard dissimilarity indices in each sample type. The boxplots represent median (midline), interquartile ranges (shaded boxes), and ranges (whiskers). Data is shown according to the age (years) of the children with AOM.

