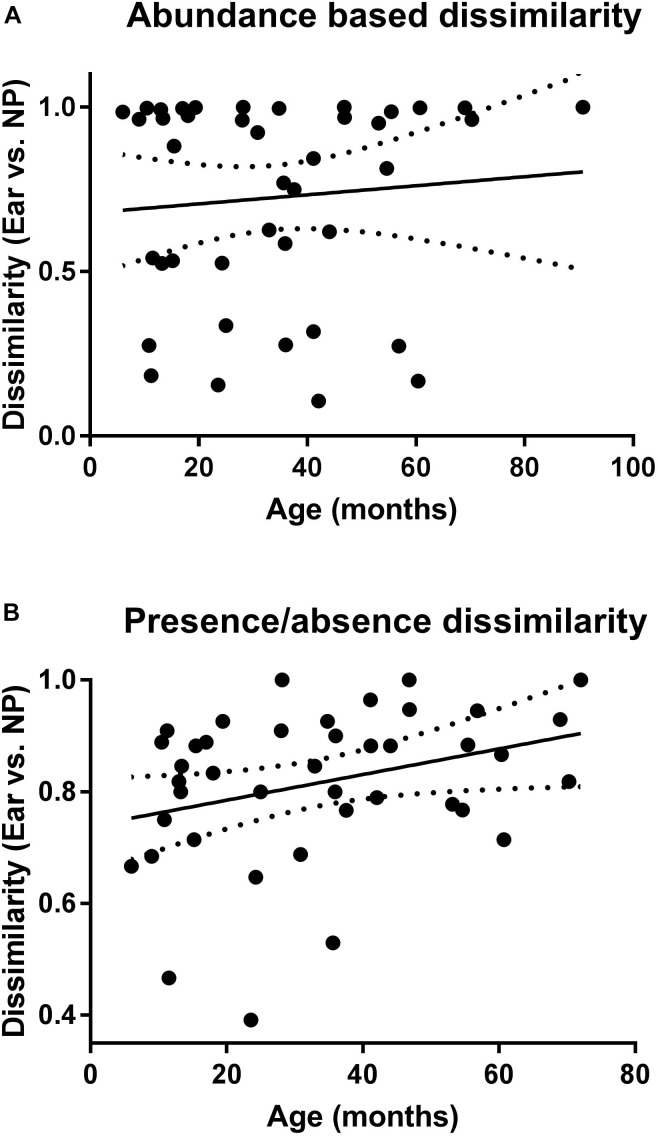
FIGURE 5.
Correlation of the microbiota of NP and MEF according to age. Shown are the abundance (A) and presence/absence (B) based dissimilarity values (for NP and MEF) for the children with AOM at different ages. Linear regression lines are indicated. P-value is significant for the presence/absence based dissimilarities (P = 0.04).

