
Figure 1.
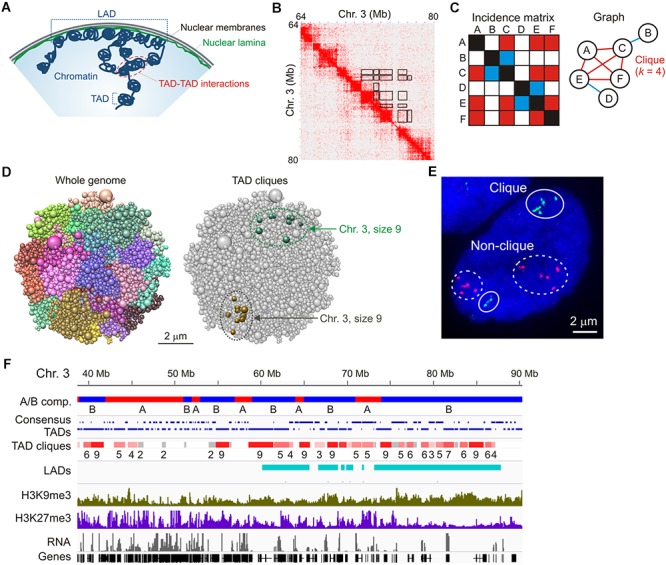
TAD cliques represent spatial assemblies of heterochromatic TADs from Hi-C data. (A) Higher-order chromatin topology in a mammalian nucleus, highlighting a lamina-associated domain (LAD), topologically-associated domains (TADs) and TAD-TAD interactions. (B) Hi-C contact matrix showing TADs along the diagonal and highlighting some of the long-range TAD-TAD interactions, away from the diagonal (black frames); shown here for a region of chromosome 3 in human adipose MSCs. (C) Graph representation of a clique where four vertices (or TADs; A,C,E,F) all interact pair-wise in the fictive incidence matrix (red cells in the matrix, red edges in the graph). Vertices B and D, respectively, interact with vertices C and E only (blue cells in the matrix, blue edges in the graph) and do not belong to the clique. The clique shown here is of size k = 4. (D) Chrom3D structural models of an MSC nucleus. Models show all chromosomes as a continuous chain of beads (TADs) labeled differently (left) and highlight TAD cliques of size 9 on both chromosome 3 homologs (right). Note the variation in TAD proximity in both modeled chromosomes. (E) Representative FISH image of six TADs in a clique (green probes; chromosome 1) and five TADs not in clique (red probes; chromosome 5) (see Paulsen et al., 2019 for details). Note the absence of strict physical contact between all TADs even when they belong to a clique in the Hi-C data (green probes). Also note the variation in relative TAD distributions between the two sets of homologous chromosomes. Bar, 2 μm. (F) Browser view of A and B compartments, consensus TADs (shown over two lines for clarity), TAD cliques with clique size (number of TADs), LADs, H3K9me3, H3K27me3 and gene expression in undifferentiated adipose MSCs. Sequence data can be accessed at NCBI GEO GSE109924 (compartments, TADs, cliques and LADs), GSM621398 (H3K9me3), GSM621420 (H3K27me3), and GSE60237 (RNA).