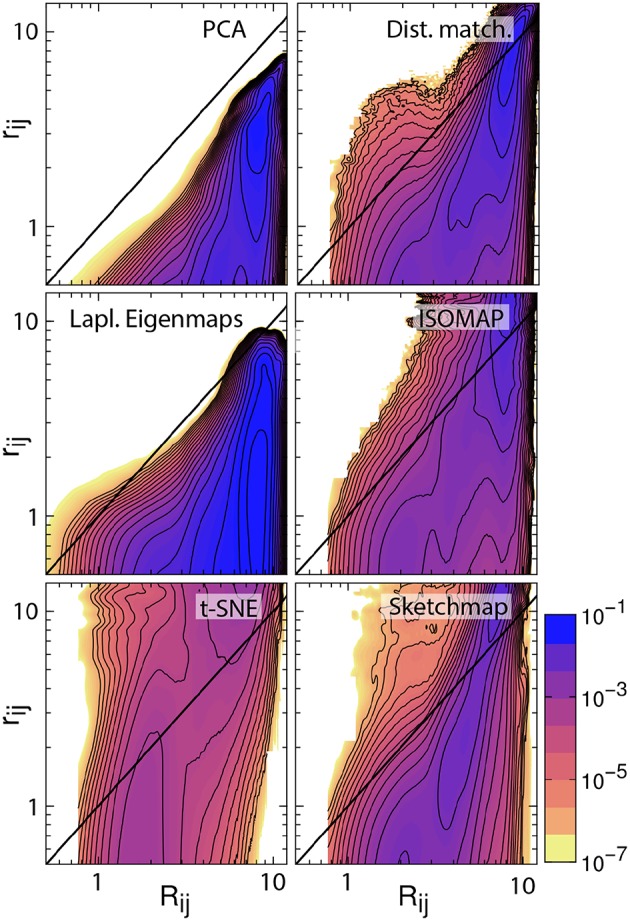
Figure 2.

Histograms illustrating the joint probability density function for the dissimilarities between the configurations in the trajectory and the distances between the corresponding projections of these trajectory frames. The particular projections that have been analyzed here are those that are shown in Figure 1. The black line in each of these figures is the line Rij = rij. For an ideal projection all the density in these histograms would lie on this line.
