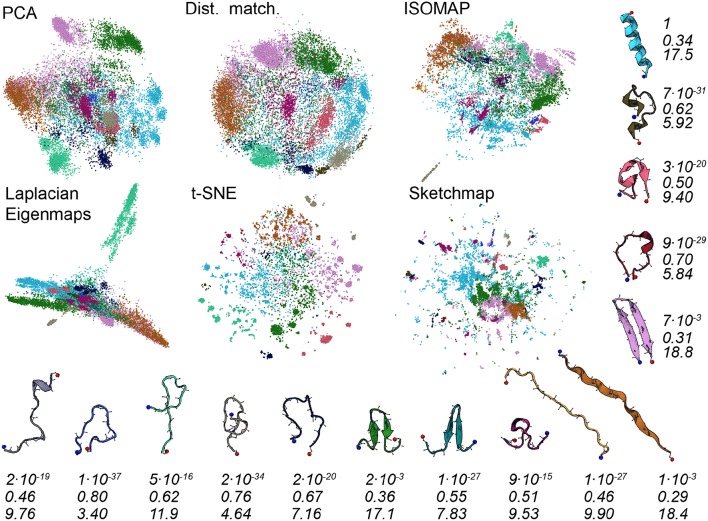
Figure 3.
As discussed in the text, we used the PAMM clustering algorithm to identify clusters that correspond to free energy minima in the high dimensional space. In this figure, we have thus shown the projections again but this time with the points colored according to the particular cluster the PAMM algorithm identifies each of the high dimensional configurations to lie within. Representative and similarly-colored configurations from each of the various clusters are shown below and to the right of the projections. The three rows of numbers beneath the representative configurations provide information on the covariance matrix for each of the clusters that PAMM identified. The top row of numbers contains the determinants of this matrix but these numbers have been scaled so that the cluster with the largest determinant has a determinant of 1. To compute the second row of numbers, meanwhile, we divided the sum of the first two eigenvalues of these covariance matrices by the sum of all the eigenvalues of these matrices. The final row of numbers contains the estimated dimensionality of each of the clusters, which was computed using Equation 3.

