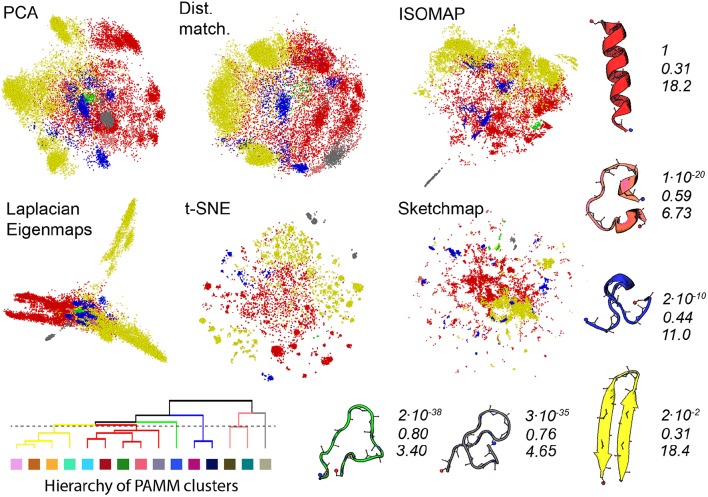
Figure 4.
As discussed in the text, we can use an agglomerate procedure based on the error in the KDE procedure that is at the heart of PAMM to construct the hierarchy shown in the bottom left corner of this figure for the PAMM clusters that were identified and shown in Figure 3. This hierarchy would seem to indicate that we can reduce the 11 PAMM clusters shown in Figure 3 down to 6 macro clusters. In the projections above the points are therefore colored according to the particular macro cluster the PAMM algorithm identities each of the high dimensional configurations to lie within. As in Figure 3 representative and similarly-colored configurations from each of the various clusters are shown below and to the right of the projections together with scaled values for determinant of the covariance matrices for each of the clusters (Top), ratios of the sum of the largest two eigenvalues of these matrices to the sum of all the eigenvalues of these matrices (Middle) and the estimated dimensionality of each of the features (Bottom).

