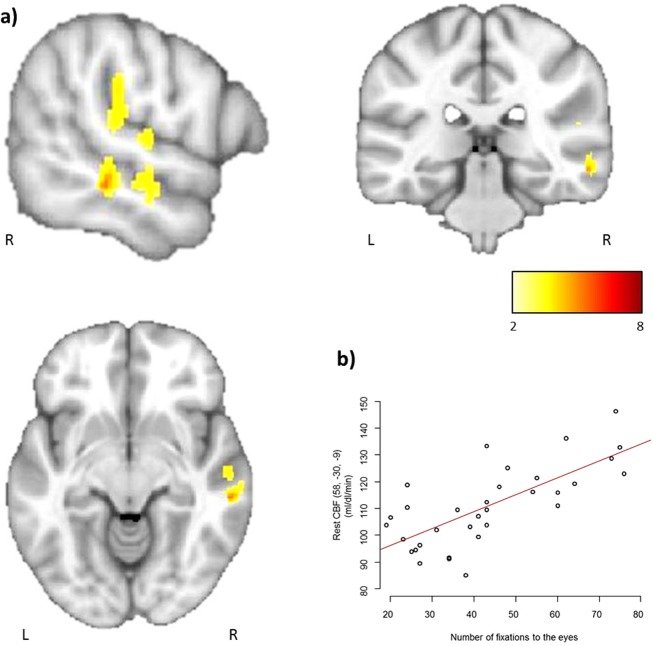
Figure 4.
(a) Results of whole brain correlation analysis between the number of fixations to the eyes, measured by eye-tracking, and rest CBF, measured by ASL-MRI, overlaid on the MNI-152 template average brain (for illustration purposes, p values were set to 0.001 uncorrected). The MNI coordinates of the two significant peaks at p < 0.05 Family Wise Error (FWE) corrected for multiple comparisons at both the voxel and cluster level: x = 51, y = −25, z = 22; T = 5.89; PFWE = 0.009; kE = 48, PFWE = 0.008 and x = 58, y = −30, z = −9; T = 5.47; PFWE = 0.024; kE = 3, PFWE = 0.038. The color bar represents T-scores. (b) Plot of the correlation between the number of fixations to the eyes and the individual rest CBF values.

