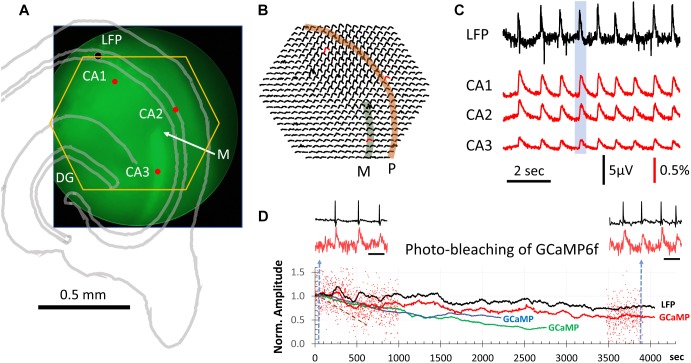
FIGURE 1.
GCaMP population signals of SWs across hippocampal subfields. (A) Slice positioning over the diode array. The end of mossy fibers (M) and lack of GCaMP6f expression in CA2 was used to identify the three hippocampal subfields CA1-3. The yellow hexagon marks the field of view of the diode array. The black dot marks the location of the LFP electrode. These structures were also outlined with an image of transmitted light (gray lines). (B) ΔF/F from all 464 diodes during a SW event. This SW was one of the 9 occurring during a 9-s recording sweep (blue box in C). Note that GCaMP signals of SWs were seen over a large area across CA1, CA2, and CA3. Str. pyramidale (P, orange band) and mossy fiber bundle (M. f∖green band) are identified overlaying the signals. (C) LFP signals were simultaneously recorded with the GCaMP signals (both sampled at 1,616 Hz). Signals from three detectors in CA1, CA2 and CA3 [red dot/traces in panels (A,B)] plotted together with the LFP recording (filtered 0.1–30 Hz). The amplitude of SWs in the GCaMP signal were on average 0.3% ΔF/F with a signal-to-noise >10. From 11 slices we recorded ∼6,500 SW events optically, all with a clear one-to-one correspondence between LFP and optical GCaMP signals. (D) Decline of optical signals over long recording periods due to photobleaching. Red dots mark the relative amplitude of individual SWs from one slice recording. For clarity, events are only shown for the first 1,000 and last 500 s. The relative ΔF/F amplitude is normalized to the average amplitude of the first 100 events at the beginning of light exposure. Black and red traces are averages of the LFP and GCaMP signals, respectively, in a sliding 100-event window. Blue and green traces are GCaMP signals from two additional animals. Brown broken line: another slice with exposure at 6 times the light intensity for 660 s. Left and right insets: LFP and GCaMP signals from one slice before and after 4300 s of continuous light exposure. Blue broken line in panel (D) marks the sample time of the two traces. Note that amplitude reduction due to photobleaching is not obvious in individual SWs, as spontaneous SWs have a large variation in amplitude. Scale bar for inset = 1 s.

