FIGURE 2.
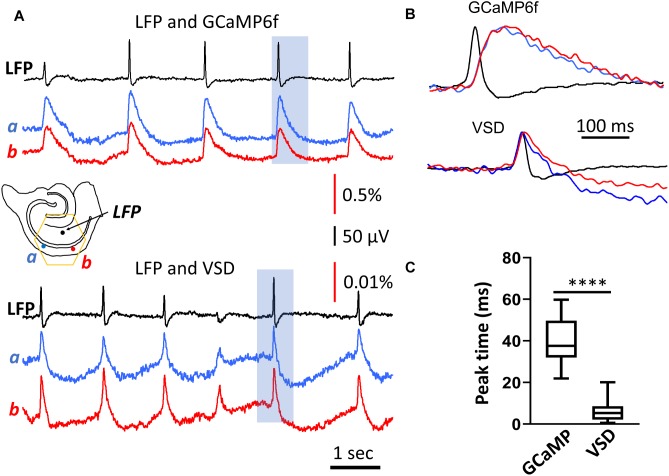
Rise time of the population GCaMP6f signal. (A) LFP and GCaMP/VSD recordings of SWs in the same tissue. LFP (black trace, filtered 0.2–50 Hz) were highly correlated with events detected optically at two different CA1 locations either with GCaMP6f (blue and red traces, top, filtered 0.2–50 Hz) or VSD (blue and red traces, top, filtered 0.2–50 Hz). Note the different y-scale for GCaMP and VSD traces, GCaMP events were about 50 times larger and slower. Black arrows mark the SWs displayed in expanded time scale in panel (B) GCaMP signals showed a marked delay compared to the LFP, which was not observed in the VSD signals from the same tissue. (C) Box and whisker plots of the peak delay time between LFP and optical signals. As expected, GCaMP signals showed a longer delay time of 40.3 ms (SD 10.8 ms, n = 84 SWs, in two slices from two animals) compared to VSD delay time of 5.7 ms (SD 4.1 ms, n = 82 SWs from same slices), a significant difference of p < 0.0001 (Mann-Whitney).

