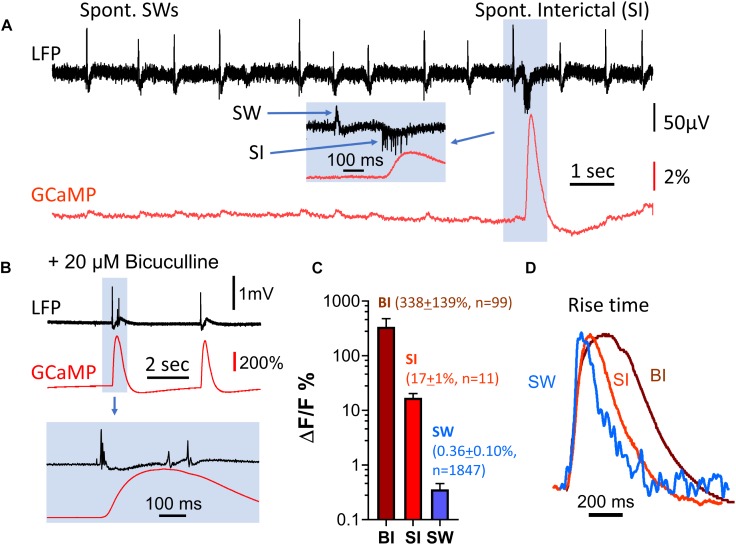
FIGURE 4.
Amplitude discrepancy between LFP and GCaMP signals during interictal-like events. (A) Spontaneous interictal events (blue box) rarely occur in healthy slices, and are associated with a low LFP peak amplitude but disproportionally large GCaMP fluorescence. The GCaMP signal was measured from the CA1 area, in a region of interest approximately 0.1 mm in diameter surrounding the location of the LFP electrode. Inset (blue box): expanded time scale of the event, showing cellular spiking and the LFP peak of the interictal event. (B) Interictal-like events induced by bath supply of 20 μM bicuculline. Bottom traces display event highlighted in blue box above on expanded time scale. (C) Comparison of GCaMP6f ΔF/F amplitude for three types of events. BI: bicuculline-induced interictal-like spike, average ΔF/F = 338 (SD 139%, n = 99 events from four slices from four animals). SI: spontaneous interictal event, average ΔF/F = 17% (SD 1%, n = 11 events from one slice from one animal), SW: sharp wave, average ΔF/F = 0.36% (SD 0.10%, n = 1847 events from the same slice with SIs). Error bars indicate SD. (D) Rise time of sharp wave (SW), spontaneous interictal events (SI) and bicuculline-induced interictal-like spikes (BI). The amplitude of the three events differ by a factor of ∼600 but have similar initial rise times. Note that the decay time of the three events are different. These traces are averages of n = 100 SWs from one animal; n = 11 SIs from the same animal; n = 10 BIs from a different animal.

